Tag: PIHN

  • Police-involved shootings and hispanics

    I asked Jim, my Dominican-born Austin-raised San Francisco-living white friend, why he thought so many Californian cities were high on my PIHN list. He thought for a very few short seconds and answered, “because hispanics aren’t violent but police think they are.”

    I love over-generalizations and stereotypes that could very well be true.

    So I got black and hispanic percentages for my 40 cities and ran correlations to see if there was anything related with race, hispanic, the city’s homicide rate, the police-involved homicide rate, and PIHN.

    More blacks in a city correlates with a higher homicide rate but not significantly with the rate of police-involved homicides. That last part is surprising.

    A higher hispanic percentage in a city correlates with a lower homicide rate (which shouldn’t be surprisingly, unless you only listen to Fox News) and is also not related to the rate of police-involved shootings. OK.

    Of course a high homicide rate correlates very much more police-involved shootings (that I knew, and is the whole reason behind this PIHN idea).

    And black and hispanic percentages in cities both correlate with PIHN, and in opposite directions. More hispanics mean a higher PIHN. More blacks a lower PIHN. Another way to look at this is to say that hispanics live in less violent cities, but those cities do not see the expected correlated decrease in police-involved shootings.

    Now this might be counterintuitive to some, but it makes sense if once thinks of all the flack police can get when they shoot a black person (even an armed person who shot at police). For better and for worse, perhaps cities with more blacks are better organized to complain about police-involved shootings. Sure, these protests piss off police, but they could also lead to better training, fewer police-involved shootings, and police less likely to pull the trigger.

    How often do whites or hispanics complain after a questionable shooting? Not so much.

    So could police be disproportionately killing hispanics? Seems possible… but turns out not really.

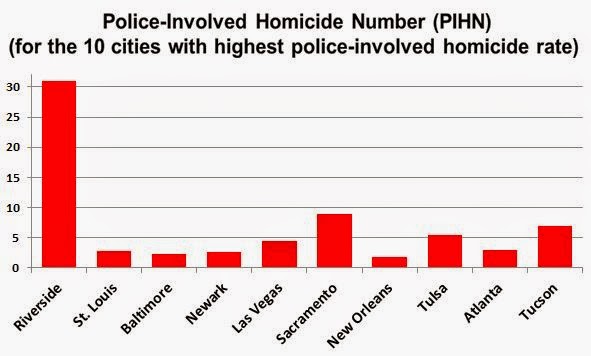
    In trigger-happy Riverside, which is 52 percent hispanic and 6 percent black — if the data is accurate — hispanics are not overrepresented in police-involved shootings (68 over 15 years). Other than the massive number of police-involved homicides, nothing jumps out at me. When hispanic-or-not is listed (80 percent of the time), 36 percent of those killed by police are listed as hispanic. 13 of the 68 were black (disproportionately but not unexpectedly high).

    In Mesa, which is 28 percent hispanic and has only 3 blacks (just kidding, Mesa is 3 percent black), police killed 40 people over 15 years. Only one of the 40 was black. When ethnicity was listed, about one-third of those killed were hispanic.

    I also looked at San Diego and Dallas, and could find nothing that stood out. So this seems to be a bit of a dead end. It’s also entirely possible that hispanics are listed as non-hispanic for whatever reason. I don’t know.

    Basically, if there’s any conclusion to be reached, it seems that in cities with a lot of Mexicans, whites are more likely to get shot and killed by police. This isn’t what I really expected. Though it’s not hard to imagine a lot of poor messed-up whites living in trailer parks in the desert, maybe I watched too much Breaking Bad.

    Any ideas? (Especially ones that aren’t particularly statistically advanced.)

  • The PIHN Winners

    The winner, still by far, is Riverside, CA. But sneaking into second place is Mesa, Arizona, the only non-Californian city in the top 6.

    Here’s the top 20 with the PIHN. All 20 are west of the Mississippi:

    Riverside: 31

    Mesa: 14

    San Diego: 12

    Sacramento: 9

    Bakersfield: 8

    Seattle: 8

    Portland: 8

    Albuquerque: 7

    Fresno: 7

    Tucson: 7

    San Jose: 7

    Long Beach: 6

    Colorado Springs: 6

    Oklahoma City: 6

    Denver: 6

    Phoenix: 5

    Tulsa: 5

    Austin: 5

    San Antonio: 5

    The first city east of the Mississippi is Philadelphia, which has a PIHN of 2.9. This mean that police in San Diego are 4 times more likely to kill somebody, taking the overall homicide rate into account.

    I compiled and ran the numbers for 40 cities for which I believe the UCR data on justified police-involved homicides seems valid for the past 15 years. By “seems” I mean me looking over the numbers to make sure there’s an entry for every year and that the overall number in close to what one might expect, based on population and crime. Once I supplemented missing data with other data (New York City), and once I just averaged from fewer years (San Antonio).

    Cities which I think lack valid data include Boston, Charlotte, Detroit, El Paso, Fort Worth, Honolulu, Jacksonville, Louisville, Virginia Beach, Omaha, Arlington, Raleigh, Miami, Washington DC, and Wichita. But except for those, I compiled numbers for every city larger than 350,000 (and a few smaller ones, too).

    But when the PIHN gets below two, I start to suspect some of the data is missing. But who knows? Maybe I’m not giving credit where credit is due.

    There’s also the possibility that the PIHN adjusts too much for violence. It does, in effect, punish cities for being safe. But police officers in “safe” cities might be quicker to shoot, since they’re less used to danger. Certainly cities with low homicide rates rank high on the PIHN scale. But not always. Sacramento has a high homicide rate and a high PIHN. New York has a low homicide rate and a low PIHN. But it might be more interesting to make a scale which eliminates any correlation between PIHN and a city’s homicide rate. But I also suspect, based on experience, that police in high-crime areas deserve more credit than they get for not shooting. Some of the bad shootings I’ve seen recently… I can’t imagine a cop in Baltimore being so damn scared for no good reason.

    There are fewer than 15 homicides a year in Riverside. Given that, it seems hard to believe that police kill almost five a year.

  • What’s up, Riverside?

    What’s up, Riverside?

    The city of Riverside, California appears to be, by far, the city in which police are most likely to commit justifiable homicide. I listed a rough rank order of cities in my previous post. Riverside is almost 50 percent higher than the next highest cities, St. Louis and Baltimore. (Even more so if one takes into account Riverside’s population gains over the past decade.)

    Riverside police kill an average of 4.5 people a year. This is very high for a city with about 300,000 people. New York police kill about 13 people per year. But NYC has 8 million friggin’ people!

    Other cities with a lot of police-involved homicides, like St. Louis and Baltimore, have a lot of crime. Not Riverside. Over the past decade (2003-2012) there have been 14.6 homicides per year in Riverside. This is on par with about the national average of 5 per 100,000. St. Louis, by comparison, about the same size as Riverside, sees about 126 murders annually. Baltimore, twice as large, has averaged 248 murders. Baltimore and St. Louis have a lot of murders. Since there are more murderers, one would expect police to shoot more of them.

    But Riverside?

    I’ve invented an acronym called PIHN. It stands for “Police-Involved Homicide Number.” I’ve also decided it’s pronounced “pin.”

    PIHN takes a city’s violence into account and assumes a direct relationship between homicides in a city and police-involved shootings in that city. A higher PIHN means that there are more police-involved homicides for a given level of violence (presumably a poorly trained more trigger-happy police department). A low PIHN means fewer police-involved homicides (a better trained and less trigger-happy police department).

    I applied PIHN to the 10 cities with the highest rate of justifiable police-involved homicides in America and also to the 10 largest American cities. First the cities in which police kill a lot of people, per capita.

    Notice the cities ranked 2, 3, 4 (St. Louis, Baltimore, and Newark) in police-involved homicides drop way down if one takes the homicide rate into consideration.

    Here are the 10 biggest cities. New York, even with a low crime rate, has a low PIHN. Not surprising to me, because the NYPD is very restrained in shooting (despite what you may read). And there’s a general clustering between 2 and 4 for the top five.

    (Note the scale on this figure is half of the other one)

    San Diego is interesting because it doesn’t even rank in the top 25 for the overall rate of police-involved homicides. But San Diego is a safe city, overall. Given the low number of homicides in San Diego, the high number of police-involved homicides — a PIHN close to 12 — is unexpected and striking.

    Among the 20 cities I looked at, there’s a cluster of PIHNs between 2 and 3: Philadelphia, Atlanta, Chicago, St. Louis, Newark, New York, Baltimore, Dallas, and New Orleans. There’s variance, to be sure, but they’re all kind of in the same ballpark.

    And then you go west of the Mississippi and the PIHNs skyrocket, particularly in California. Tulsa’s PIHN is 5.4. Sacramento is 8.9. And Riverside, California? Riverside’s PIHN is 31.1! That’s crazy high. Here are the highest PIHNs:

    (Keep in mind this top-ten list comes only from the 20 cities I calculated, which are the 10 largest cities and the 10 cities with the highest police-involved homicide rate, based on URC data.)

    Riverside, California. What is up with Riverside?

    [You too can calculate PIHN! Divide the police-involved homicide rate or number by the average overall homicide rate or number. I used 2003-2012 homicide data from city-data). And then multiply by 100 to get a PIHN greater than 1. Or I’ll do it for you if you do some of the grunt work. Go to city-data, enter the city of your choice, scroll down to crime, add up the homicides numbers from 2003 to 2012.]

    [Data for San Antonio police-involved homicides are averaged from just the past six year, since they didn’t report to the UCR before then.]

  • PIHN (police-involved homicide number)

    I’ve invented a statistic (and acronym) called PIHN (pronounced “pin”). It stands for “Police-Involved Homicide Number.”

    PIHN looks at police-involved homicides but takes a city’s violence into account. PIHN assumes a (very questionable) direct relationship between homicides in a city and the number police-involved homicides one might expect.

    A high PIHN means that there are more police-involved homicides for a given level of violence (and perhaps a poorly trained and/or more trigger-happy police department). A low PIHN means fewer police-involved homicides (perhaps a better trained and less trigger-happy police department).

    You too can calculate PIHN! Divide the police-involved homicide rate or number by the average overall homicide rate or number. I used 2003-2012 homicide data from city-data. And then multiply by 100 to get a PIHN greater than 1.