Tag: stats

  • After a 200-percent decrease in basic math skills…

    As promised, here is how to determine basic percentages. Too many of my college students don’t understand basic percentages. Clearly GTF has the same problem. So here is how it works — in words — with no math symbols. I’m totally serious. It’s never too late to learn. And not knowing how to relate “doubled” and “100% increase” is the mathematically equivalent of being functionally illiterate.

    To say how many times something increased, simply divide the second number by the first: There were 10 arrests; now there are 30. 30 divided by 10 is 3. Arrests tripled.

    To figure out a percent increase or decrease, subtract the first (earlier) number from the second (later) number and then divide the result by the first number (multiply by 100 — move the decimal place over two to the right — to get a percentage).

    30 minus 10 is 20; 20 divided by 10 is 2; 2 times 100 is 200. So 30 arrests is a 200 percent increase compared to 10. A 100 percent increase would be the same as saying something doubled.

    Going the other way, from 30 to 10 arrests would be one-third as many arrests or a two-thirds decrease or a decrease of 67 percent.

    And nothing, not even math skills, can decrease more than 100 percent.

    Next I’m going to talk about rates.

  • This is the DEA’s Brain on Okra

    This is the DEA’s Brain on Okra

    marijuana

    I wonder if an end-the-drug war voter is just an law-and-order conservative whose backyard okra garden was raided by local cops after being spotted from a helicopter funded by the Drug Enforcement Agency Domestic Cannabis Eradication/Suppression Program?

    Barstow County, Georgia, resident Dwayne Perry may be a recent convert: “I do the right thing and they come to my house, strapped with weapons. It ain’t right…. The more I thought it. What could have happened? Anything could have happened.” Indeed.

    Now I don’t know Mr Perry’s politics, but seeing how he is a white man in a conservative Georgia county (Republicans out number Democrats 8:1) I’m assuming he didn’t cast his ballot for any progressive candidate wanting to end the drug war. I wonder if Mr. Perry will see a connection between the so-called “law-and-order” politicians he votes for and the police who mistook him for the enemy? [More likely, as my wife pointed out, he will just blame Obama.]

    But my point does not actually concern Mr. Perry, okra aficionado. It’s almost pointless to keep highlighting absurdities in the war on drugs because if you’re not convinced by now, it’s doubtful one more anecdote will persuade you. Even if this anecdote, you do understand, concerns a helicopter being used to spy on an innocent American which was then followed by a police raid on the backyard garden of an innocent American because the drug warriors incorrectly though okra was marijuana (a relatively benign drug that is partially legal in 23 states and the District of Columbia).

    okra

    Regardless, it is worth reading Christopher Ingraham’s informative Washington Post post about this raid. Did you know that close to 98 percent of all the domestically eradicated marijuana is “ditchweed”? I didn’t! And “ditchweed” — I’m not making this up — is a technical Department of Justice term for wild non-tended marijuana that contains little if any THC. They’d be more productive pulling up kudzu!

    Anyway, I clicked through to the Georgia Department of Public Safety Governor’s Task Force/Drug Suppression (GTF) webpage, because that’s the type of thorough bathrobe-wearing research you can expect of me. I always like to know what our hard-working taxpayer-sucking drug warriors are up to:

    2012 Operational goals were exceeded with an increase over 2011 in plants eradicated, arrests, weapons seized and asset seizures…. GTF initiated and developed intelligence for grow operations throughout the state. The intelligence was then forwarded to local agencies. Subsequent investigations resulted in numerous arrests and seizures. The 2012 statistics indicate the degree of success in achieving primary operational goals.

    Those numbers aren’t easy to read, but let me highlight a few lines:

    2011 Outdoor Grow Plants Seized: 18,710 Plants

    My actual calculator! You probably use a phone.

    2012 Outdoor Grow Plants: 67,634 Plants

    72% increase

    2011 Indoor Grows Located: 20

    2012 Indoor Grows Located: 24

    16% increase

    2011 Asset Seizures: $812,248

    2012 Asset Seizures: $3,952,307

    79% increase

    Notice anything? The math doesn’t make sense. And it’s not that they’re trying the old DEA trick of making shit up to make them look good. I think they’re just dumb. While a couple of computations are actually correct, the grade overall, based on 2.5 correct out of 8, would still be an F.

    Now look, we all make mistakes. I make typos all the time, and it’s easy to punch a wrong number into a calculator. But thinking a 387 percent increase is less than 100 percent is absurd. You can pretty much mentally check “more or less than double” in your head. And a more astute practitioner of basic math skills might just know that 20 to 24 is a nice round 20% increase (and not 16%). After that even I need to break out my calculator. So I did:

    Now I don’t know if bad math is a direct cause and effect related to the Georgia legislature cutting $8.4 billion from public schools, but the math skills of Georgia’s drug warriors are just as bad as their botany identification.

    Regardless, asset forfeiture increased nearly four-fold from 2011 to 2012, presumably because the warriors have a helicopter. They can look in your backyard and, if they find drugs, take your property. These cops weren’t hoping to dig up Mr. Perry’s weeds. They wanted to seize his whole damn house!

    (In my next post I’ll tell you how to figure out percentages. For real.)

  • Can We Trust Crime Numbers?

    The need for better crime stats, from David J. Krajicek at the Justice Report.

    “I don’t think we know if we’re in the midst of a heroin epidemic. I do know there are localities where the numbers are up. But to use numbers from four years ago as evidence of an urgent national problem today is pointless and silly. It just shows you how primitive the crime information infrastructure remains in this country.”

    BJS touts its role as a source of statistical evidence for new “smart-on-crime” policies. Yet the relevance of its dated evidence is in question: BJS has not produced a new report on recidivism since 1994.

    To be fair, no one blames the overtaxed statisticians who work at BJS.

    James Lynch, BJS director from 2010 through 2012, says the bureau has been hollowed out by funding cuts as a result of the 2013 federal budget sequestration, a hiring freeze and animosity toward the Department of Justice on Capitol Hill.

    “BJS has been under-resourced for many years,” Lynch, now a criminal justice professor and department chair at the University of Maryland, tells The Crime Report. “If you want timely statistics, then bang on the door of your damned congressman.”

    BJS has been subject to a Justice Department hiring freeze since 2011, and its 2014 budget of $45 million is unchanged from 2009, according to a bureau spokeswoman.

    That budget is miniscule by federal standards. Its Department of Labor equivalent, the Bureau of Labor Statistics, has a 2014 budget of $592 million.

  • Crime is up no wait down: NCVS

    There are two main clearinghouses for crime stats in this country, the UCR (The Uniform Crime Report) and the NCVS (National Crime Victimization Survey). The former is collected from police departments and thus only includes reported crime as recorded by the police. The latter is conducted by surveys and sampling and asks people (160,000 per year) if they were a victim of crime. They both can be useful in different situations, though I’m much more partial to the UCR.

    Now here’s the thing: The UCR says violent crime in 2012 is down 3% compared to 2010.

    The NCVS says violent crime is up 39% in the past two years.

    They can’t both be right.

    And I seriously suspect the NCVS is wrong.

    Update:

    I believe in 2015 the NCVS surveyed but a *total* of 260 black male crime victims. For a national sample. (From 20,837 “black only” sampled.) Just 100 black male victims 35 or under? That seems problematic. Weighting is about 2,700 per individual.

    Also, blacks are 11% of respondents, undercounts population approx 17%. (whites are overcounted at +5%) And there’s no reason to assume non-respondents/missing data are random. I would assume non-respondents have higher rates of being victims.

  • While I’m out…

    Check out this lengthy piece (and well worth reading the whole thing) by David Simon about murders, stats, the BPD, the state’s attorney’s office, and the need for main-stream media. (And thanks to an anonymous comment for cluing me in.)

    The Stat:

    In 2011, the Baltimore Police Department charged 70 defendants with murder or manslaughter.

    Yet in 2010, the department charged 130 defendants with such crimes.

    What is happening?

    Are Baltimore’s killers showing more cunning, are murders becoming
    harder to solve?  No indication of that from any quarter.  Did the
    homicide unit lose a ton of veteran talent?  Nope.  Not between 2010 and
    2011 at any rate.  No, the dramatic collapse of the department’s
    investigative response to murder is the result of a quiet, backroom
    policy change that has created a bureaucratic disincentive to charge
    people in homicides.

    Also, and unrelated, McCarthy in Chicago says police don’t have to answer stupid 911 calls for service anymore. It might seem minor, but this could have a huge impact on policing (as Chapter Six of Cop in the Hood — “911 is a Joke” — describes in breath-taking page-turning detail). McCarthy is talking about “beat integrity” and says he’s willing to face the political flack for fewer police responses. He also wants to give powers of where police go to police bosses (instead of giving all the power to the dispatcher). This is all good. (Maybe in Baltimore they’ll actually bring a box back to put call in!) From the Sun-Times:

    McCarthy replied that the change was
    already under way, with the goal of creating, what he called “beat
    integrity.” That means leaving police officers to patrol their assigned
    beats, instead of chasing their tails by running from one 911 call to
    another at the behest of dispatchers. …

    “Previously, the dispatcher would direct
    the resources, while the sergeants in the field would basically just be
    receiving them. [Now], sergeants in the field are in charge of
    dispatching resources if they don’t like the way [dispatch] is doing it. …

    [Dispatch] has also abandoned what McCarthy called the “clean screen concept” at the 911 center.

    “They would dispatch a car from one end
    of the district to the other end of a district to simply get the job off
    the screen. That’s the clean screen concept,” he said.

    “What we’re now doing is maintaining
    beat integrity. … If a job comes in in a neighboring beat and it’s not
    an emergency call for service, that job will actually get stacked until
    that beat is available to handle it. That’s what beat integrity is all
    about. Same officers in the same beat every single day. Those officers
    are not only accountable for what’s happening on the beat, they also
    know who the good kids are from the bad kids. They’re not stopping
    everybody. They’re stopping the right people because they know who they
    are.”

    McCarthy said a more dramatic change is
    coming soon, when the Chicago Police Department determines “which jobs
    we’re not gonna respond to” anymore.

    “That’s a call that I’m going to make — and there’s going to be some wrankling about that,” he said.

    “We don’t need to respond to calls for
    service because, ‘My children are fighting over the remote control.’ We
    don’t need to respond to calls for service because, ‘My son won’t eat
    his dinner.’ Unfortunately, believe it or not, those are calls we
    actually respond to today.”

     And the political flack will come when one of the my children are fighting over the remote calls turns into a homicide. But you can’t dedicate half the police department to every idiot who can pick up a phone.

  • Food Deserts: Quantitative Research at its Sketchiest

    Food Deserts: Quantitative Research at its Sketchiest

    The New York Times reports today on a RAND study (behind the Great Damned Elsevier Pay Wall) by Ruopeng An and Roland Sturm about the lack of “food deserts” in poor neighborhoods. Or more precisely about the lack of link between food deserts and obesity. More specifically, it questions the very notion of food deserts. From the Times:

    There is no relationship between the type of food being sold in a neighborhood and obesity among its children and adolescents.

    Within a couple of miles of almost any urban neighborhood, “you can get basically any type of food,” said Roland Sturm of the RAND Corporation, lead author of one of the studies. “Maybe we should call it a food swamp rather than a desert,” he said.

    Sure thing, Sturm. But I suspect you wouldn’t think certain neighborhoods are swamped with good food if you actually got out of your office and went to one of the neighborhoods. After all, what are going to believe: A nice data set or your lying eyes?

    “Food outlet data … are classifıed using the North American Industry Classifıcation System (NAICS)” (p. 130). Assuming validity and reliability of NAICS occupational categories is quite a red flag. It means that if something is coded “445110,” then — poof — it’s a grocery store! What could make for easier analysis? But your445110 may not be like my445110. Does your supermarket look like this:

    Well the NAICS says it does because they’re both coded 445. New York is filled with bodega “grocery stores” (probably coded 445120) that don’t sell groceries. You think this matters? It does. And the study even acknowledges as much, before simply plowing on like it doesn’t. A cigarette and lottery seller behind bullet-proof glass is not a purveyor of fine foodstuffs, and if your data doesn’t make that distinction, you need to do more than list it as a “limitation.” You need to stop and start over.

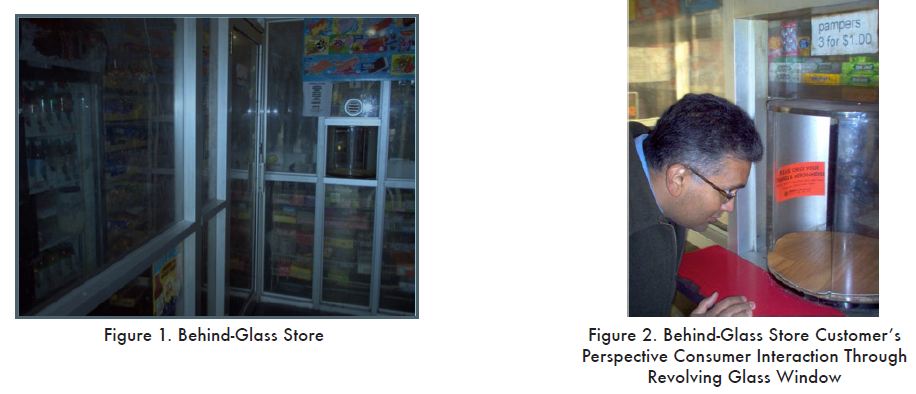
    Here’s one way to do it: a fine 2010 Johns Hopkins study edited by Stephen Haering and Manuel Franco. They actually care about their data. Read the first page in particular for the problems of food-store categorization. It matters. And notice the sections titled “residents personal reflections on their local food environment” and “food store owners’ attitudes regarding stocking healthy food.” What a concept for researchers to actually talk to people! (The picture above is from this study.)

    I find this so frustrating because so much quantitative analysis is so predictably problematic, over and over, again and again, in exactly the same way. Here’s the mandatory (and then ignored) disclaimer (p. 134, emphasis added):

    Possibly even more of a limitation is the quality of the … business listings, although this is a criticism that applies to all similar studies, including those reporting significant fındings…. More generally, categorizing food outlets by type tends to be insufficient to reflect the heterogeneity of outlets, and it is possible that more detailed measures, such as store inventories, ratings of food quality, and measuring shelf space, would be more predictive for health outcomes. Unfortunately, such data are very costly and time consuming to collectand may never exist on a national scale.

    So let me get this right, because “all similar studies” use this flawed data, it’s OK? And because getting good data may be “very costly and time consuming to collect,” we’ll simply settle for what we have at hand? Bullshit!

    You know, perhaps we never will have good data on a national level about what produce is sold in each and every store in America. I can live with that. But it is neither very costly nor time consuming to simply go into every store in any one neighborhood and see what is there. Do a spot check. Or at least read and learn from the John Hopkins study. I just found it on google without even trying. They managed just fine. And if a corner store sells three moldy heads of iceberg lettuce and some rotting root vegetables, it is not the same as Whole Foods simply because they’re both coded 445!*

    Ironically, An and Sturm may still be right about their conclusions, but more by accident than design. Maybe the focus on food deserts is barking up the wrong tree. Perhaps obesity is notcaused primarily by lack of access to good food. Maybe people do not want to eat healthy foods. Or maybe people simply don’t know how to cook. Maybe we need to bring back Home Ec. I don’t know. Certainly, I think we can agree, culture matters. But quantitative people don’t like looking at culture because it’s so hard to count. And who has the time to do time-consuming ethnographies when we’ve all got to get our name on as many co-authored quantitative peer-reviewed journal articles as possible?

    There actually is (or was?) an excellent produce store in Baltimore’s Eastern District, Leon’s Produce. Conveniently it was right by a busy drug corner. Talk about one-stop shopping! Seriously, as a cop, I could suppress the corner drug market and buy onions and carrots. And yet people would indeed pass up this local family-run store to buy a cheesesteak or yakomee.

    Maybe the problem is intense neighborhood isolation. Drawing a geographic circle around somebody and saying a grocery store is “close enough” may not matter if you’ve never left your neighborhood, don’t have access to a car, or are afraid to walk down the block. Speaking of cars, Sturm also uses CHIS data in which “Only 3% of households … report not having access to a car.”

    Well there’s another red flag.

    What does “access” mean? I suspect to some it is gathering $10 for a gypsy cab or knowing somebody who may let you borrow their car in an emergency.

    The authors acknowledge the limitations of CHIS data, and then go right on using it: “The response rate … remains low, and the current study sample has a large proportion of missing values” (30%, in fact!). If you’re looking at the problems of poverty in America and believe data that say 97% of people have access to a car, you’ve got your head up your ass.

    And if you have bad data, it doesn’t matter what fancy quantitative methods you use. It’s putting lipstick on the damn pig of correlation. Garbage in, garbage out:

    The primary dependent variables (i.e., counts of food consumption) are regressed on the explanatory variables using negative binomial regression models, a generalization of Poisson models that avoids the Poisson restriction on the mean-variance equality.

    Wow! Negative binomial Poisson regression models to avoid the mean-variance equality restriction. I (to my shame) no longer have any idea what that means, even though Poisson regressions were all the rage when I was in graduate-school. But I do remember the fatal flaw of non-random missing data.

    I’m not against quantitative methods. I’m against bad research.

    And I also believe you need to talk to the people you’re studying no matter what methods you use. I don’t trust your study on poverty if you’ve never talked to a poor person. I don’t trust your research on police if you’ve never talked to a cop. I don’t trust your research on crime if you’ve never talked to a criminal. Nor do I trust your research on obesity if you don’t talk to a fat person. And if you’re going to write about food deserts, you’d better talk to some people who live in one. If you’re not careful, you may learn something before it’s done. Once you quant-heads actually talk to the people you’re studying, then you can go ahead and run all the regressions they want.

    *Update (April 29): As one commenter pointed out, a Whole Foods is not coded the same as a corner store (because the Whole Foods is larger). Indeed. But you still get my point.


    And here’s a picture of a corner “deli-grocery” in Crown Heights, Brooklyn (NYC):

    It was in the Daily News because 14 were arrested for a running a drug ring from it. I strongly suspect it wasn’t a good place for quality groceries.

  • While I’m out…

    Play with these census data.

    In the past, to gather data like this (change in neighborhood population and demographics over 10 years) used to be so much work and take so long.

    From 1990 to 2000, the Eastern District lost about 30% of its population. (In 2002 it took me days of work to figure that out.)

    Between 2000 and 2010 the population of the Eastern decreased another 18%, bringing its population to roughly 37,750. (In 2011, it took me about an hour to figure that out.) With 39 homicides in 2010, the Eastern has a homicide rate of 103 per 100,000. Some things never change.

    (And it seems worth pointing out that there were another 7 murders just south of the Eastern in the Southeast, north of Patterson Park and south of Monument Street.)

  • “Real Men Get Their Facts Straight”

    From the Village Voice, debunking everybody from Ashton Kutcher to CNN and the New York Timeswho repeat the absurd claim that there are “between 100,000 and 300,000 child sex slaves in the United States today!”

    We examined arrests for juvenile prostitution in the nation’s 37 largest cities during a 10-year period.

    Law enforcement records show that there were only 8,263 arrests across America for child prostitution during the most recent decade.

    Compare 827 annually with the 100,000 to 300,000 per year touted in the propaganda.

    The nation’s 37 largest cities do not give you every single underage arrest for hooking. Juveniles can go astray in rural Kansas.

    But common sense prevails in the police data. As you move away from such major urban areas as Los Angeles, underage prostitution plunges.

    And keep in mind that while a 17-year-old drug addict busted for turning tricks in Baltimore is not, shall we stay, on the straight on narrow. She is not a child sex slave.

  • “Whoop whoop whoop”

    That’s the bullshit detector going off after seeing this:

    Expert: 40,000 – 50,000 slaves currently in U.S.

    How much you wanna bet he just made up that number?

    Being exploited for cheap labor does not automatically mean you’re a slave.

    Have we forgotten what slavery was?