Baltimore City Detective Sean Suiter was shot and killed two days ago while doing his job.
I didn’t know Sean, but he also came up in 1999. He had 18 years on. Were I still a Baltimore Police Officer, that could be me. His killer has not been arrested.
After his shooting I glued online to KGA, Baltimore police radio dispatch. The sadness in the voices of the dispatchers and officers was palpable. But the show goes on. The calls kept coming. There is no time-out in policing. And the routine bullshit calls keep coming. Kids were fighting in the downtown Starbucks. A man named Precious Romeo wanted his a woman removed from his house (I’m not making that up). An officer in the Eastern was at the front door of a caller but his bodycam wouldn’t activate. He was told to 10-18 (return to the district) to fill out related paperwork (thanks, federal consent decree). I wonder what the caller thought about that. And there were two other unrelated shooting victims within a few hours. One victim walked himself into Shock Trauma, adding to the chaotic scene there. There weren’t enough crime labs available for all the crime scenes. Another man was shot in the Eastern District. The Central and Western Districts were all but shut down by police activity. Officers and dispatchers were snapping at other (which is rare).
After a few hours of crazy chaos, things returned to the usual choas. Detective Suiter would live another day, but we knew it was futile, with the gunshot wound to his brain.
Rest in peace, Detective Suiter. My heart goes to his wife, his five children, and all who loved him. Rest in peace.
Welcome to WordPress. This is your first post. Edit or delete it, then start writing!
Ten years ago a crack commando unit was sent to prison by a military court for a crime they didn’t commit. These men promptly escaped from a maximum security stockade to the Los Angeles underground. Today, still wanted by the government, they survive as soldiers of fortune. If you have a problem and no one else can help, and if you can find them, maybe you can hire the A-team.
A new episode of Quality Policing is out. Check it out. We talk about many things including the DC body cam study that seems to show body cams don’t change anything. We beg to differ. Body cams just don’t change what people think they do.
We don’t, however, talk about the details of the dirty gun squad in the Baltimore Police Department. You can read about that in the Sun. The details are salacious.
Nor do we talk about the Feds busting a drug crewin East Baltimore. Arrested a dozen or so, including “Rat” and “Juicy” and recovered, get this hundreds of, er, grams of drugs.
The shop opened at 6:30AM and continued into the early evening. with about 10 drug transactions per hour. Let’s say 100 transaction a day at $10 profit per. That’s a good living. But divided by 13 plus people, it’s not that much money. One of the dealers worked “at the Sheraton Inner Harbor Hotel downtown and sold drugs to hotel guests in addition to working with the East Baltimore gang.” He remarked on a wiretap:
That it was “more stressful to have a job” than to “just be out here hustlin’.”
Ain’t that the truth.
Meanwhile in Baltimore, a supervisor in the Department of Transportation was charged by the Feds. Shoplifting turns violent. And the killing continues unabated, 23 people killed to date, this monthalone.
All this, and you’d think some city leader would take blame for something. But no, it’s never the fault of the leaders. Not as long they say they’re for “reform.” What are they reforming? Perhaps, in a city without accountability, they’re part of the problem.
On the plus side, lead is down. Maybe homicides will drop similarly in the 2030s.
Forbes came out with a list of the 10 most conservative and liberal cities in America.
Top ten conservative, in rank order:
Mesa
Oklahoma City
Virginia beach
colorado springs
Jacksonville
Arlington, TX
Anaheim
Omaha
Tulsa
Aurora
Top ten liberal, in rank order:
San Fran
DC
Seattle
Oakland
Boston
Minneapolis
Detroit
NYC
Buffalo
Baltimore
I’m not going to argue with the rankings. I don’t really care. But here’s what I thought: I bet police shoot a lot more people in the conservative cities. Related to and perhaps correlated with the fact police shoot more people, per capita, in states that are more white.
How’s this for a working hypothesis? Other things being constant (they rarely are), police shoot more people when nobody cares about police-involved shootings. And white people — particularly conservative white people — don’t really care about police-involved shootings. Period. No matter the race of those shot. And when there’s never any pushback or criticism of police, laws and training and culture do not change.
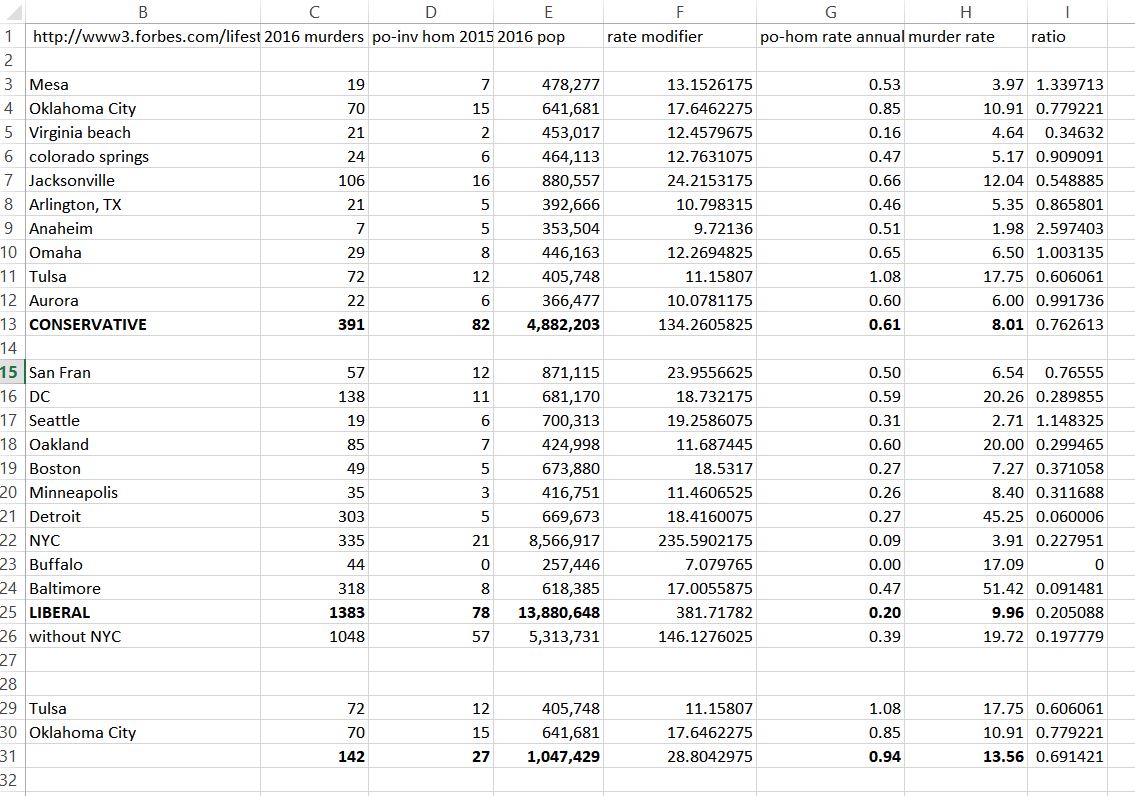
Based on Washington Post data from January 2014 through September 2016, the annual rate (per 100,000) of police-involved homicides in the top 10 conservatives cities (n = 82) is 0.61. The annual rate of police-involved homicide in the top 10 liberal cities (n=78) is 0.20.
Now New York City accounts for a lot of that, in terms of population. But even were one to remove NYC for simply being too big, the rate in the liberal cities is 0.39, or 64 percent of the conservative city average. Even without New York, cops in the most liberal cities are more than a third less likely to shoot and kill people. Are other factors involved? Sure. And they might be correlated to political ideology. Go figure them out, if you wish.
Also of note, and I’m just looking at 2016 murder numbers, the murder rate in the top ten liberal cities in 9.96, which isn’t that much higher than the homicide rate of 8.01 in the top 10 conservative cities. If you take NYC out of the equation, the homicide rate for the other 9 liberal cities goes way up to 20. But if you consider that murder is higher in the top-10 liberal cities, the lower rate of police-involved homicides is all the more impressive.
I mean, think of it this way: community violence and police-involved violence are very related. A lot of the people police shoot are violent criminals with guns, some in the process of using them. The more violent criminals there are running around shooting people, the more people police will shoot. Always has been, always will.
That said….
There were 138 murders in DC last year and every year (for the past 2.75 years) police shoot and kill 4 people. In Tulsa and Oklahoma City (which combined have 1 million people) there were 142 murdered last year and police shoot and kill 10 people. That’s a big difference. Police do shoot a lot more people out west. And it’s not just in conservative cities. In fact, given the low levels of murder in Seattle and San Francisco, the high number of people killed by police stand out.
Anaheim had but 7 murders last year and police shot and killed 5 people since 2015. In Boston, Arlington and Detroit, police also shot and killed 5 people in the past 2.75 years, but there were 49, 21, and 303 murders, respectively, in these cities. Why? My guess: a combination of cops being better trained, less afraid, and less trigger happy in these cities combined with cops also being less proactive.
Here’s the raw data I used. (Rate modifier is used in column G, (population/100,000)/2.75, because I’m using 2.75 years of police-involved homicide data.)
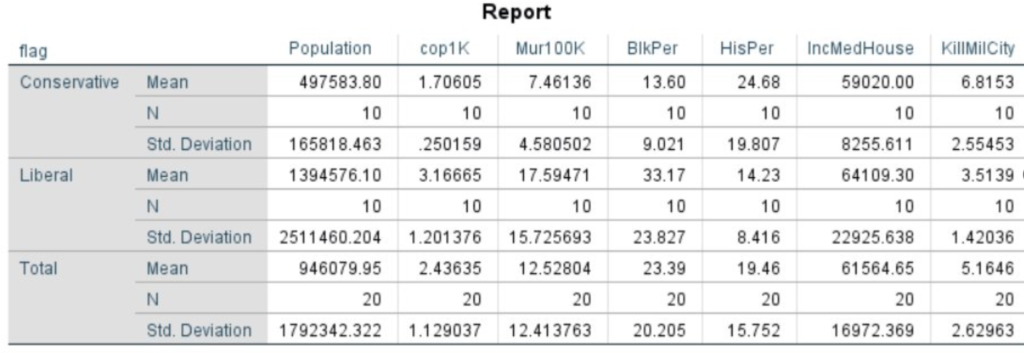
September 2020 update: I re-ran these cities using better Fatal Encounters data. Compared to top 10 liberal cities, top 10 conservatives cities have less murder, fewer cops, and shoot/kill much more often. KillMilCity is annual rate of cops killing (per million). (Leaving out NYC doesn’t change much except the mean population, drops lib cities to 603K)
Worth noting that DC, Seattle, Oakland, Minneapolis, NYC, and Buffalo jump out for having a lot of anti-police protests. None of the conservative cities do, even though cops shoot and kill many more people, even with (or because of) fewer cops. From twitter.
Nick Selby and I have a new episode over at qualitypolicing.com. Among other things, we manage to have a rational debate about gun control. Imagine that.
It’s Episode Five. (And yet somehow, from two people who claim to be good with numbers, we now have ten episodes.)
So somehow perhaps I thought doing a podcast would be less time consuming or easier than writing a blog post? No. Hell, no. Do you know what editing entails? Even light audio editing? But it’s different. Kind of fun. What the hell. I hope it’s educational (and hopefully also entertaining).
We now have six episodes up. (Even though with our odd counting system it only counts as three.) And Nick finally got a decent mic (not till be heard till the seventh episode).
Enjoy. You can add Quality Policing to your podcast subscription or download the MP3 audio file old-school style. Either way, head on over to the webpage for info and links.
1) They take a non-random sample (which isn’t bad in and of itself) and then A) don’t tell the reader in the text and B) state conclusions as if the sample were a random sample (every data point equal chance of being picked), representative of the nation.
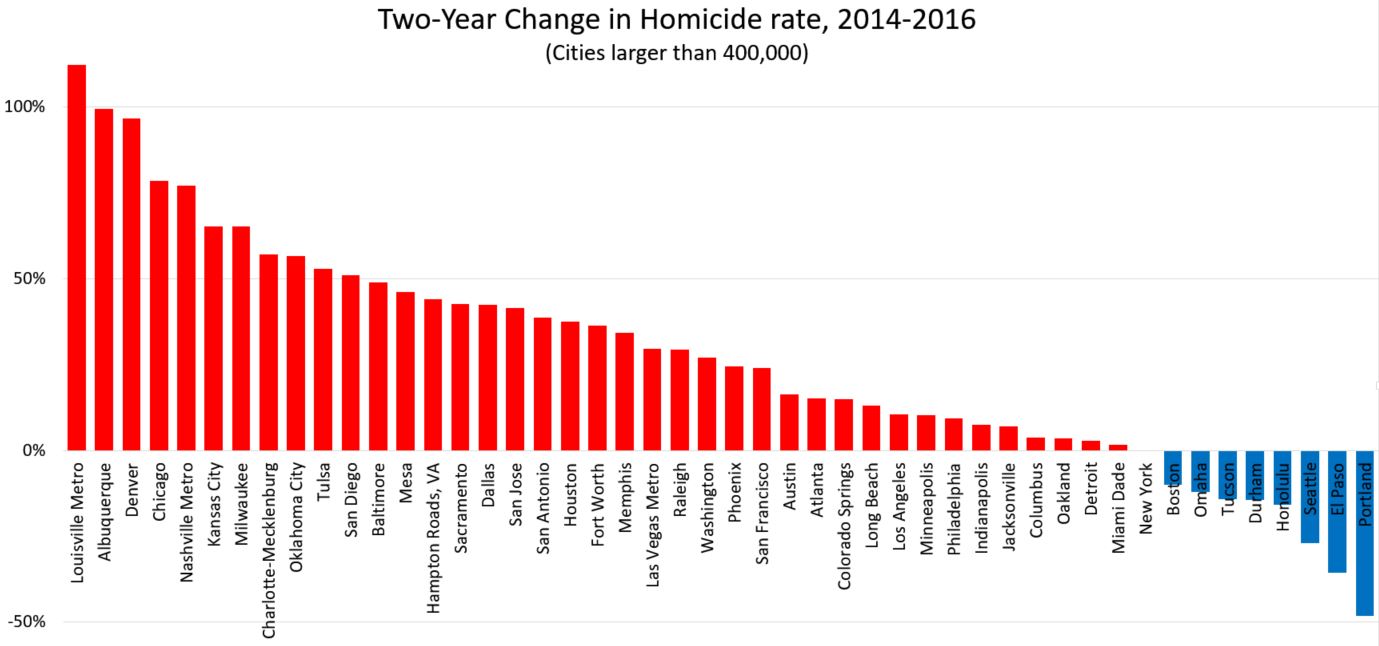
2) They take short time frames (1 year) to point out that fluctuations could be random. True. For a short time frame. They could take a longer time frames (3 years) and see more clearly developed patterns.
3) This is bit trickier to explain. And that’s why I’m giving it another shot. They base their findings on a magnitude of changes within their sample. This has the perverse effect of attention getting conclusions — “more than half” — that are noteworthy only in direct proportion to the limitations of their sample.
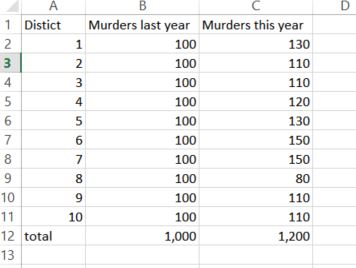
Let’s take an analogy. Say they want to look at murder in the City of Moskopolis (a fine city, despite a bit of a crime problem). So they take a sample of three police districts (out of ten equally sized police districts). Now it just so happens that we already know that murder in Moskopolis is up 20 percent. But our study looks at District #1, where murder is up 30 percent, and District #2, where murder is up 10 percent.
Now maybe District #1 is important for its own reasons. “Murder is up 30 percent in District #1.” No problem there. Or maybe, the mayor of Moskopolis prefers to give a bit of spin: “Murder is up 30 percent in District #1, but not so much in rest of city.” That’s fine, too.
But you can’t say this: “District #1 accounts for 75 percent of the murder increase in Moskopolis.” This is not true. It is false. District #1 accounts for 15 percent of the city’s murder increase.
So some guy who has a stick up his ass about accurate data (me, even though I really do have better things to be doing with my time) gets all huffy and points out this inconvenient truth to the Washington Post, which listens to me because I’m generally a trustworthy guy.
So the Washington Post calls the authors and says, “What’s up?”
“Oh,” they say. “I’m sorry. I was talking about 75 percent in my sample. Did I not make that clear?”
No. You did not. The Washington Post dutifully makes the correction and updates the story: “District #1 accounted for 75 percent of the murder increase in two districts.”
This is now no longer a false statement, but it’s a still meaningless one. Who cares about what percentage of change there is in one district in my sample? Why are we talking about two districts when we could be talking about six, eight, or even all ten of them. And here’s a doozy: What if murder went down in District 2? Could District #1 account for more than 100 percent of the increase in my sample? Mathematically, yes, says my calculator. But statistically an increase of 100 percent is absurd. Methodologically, this should be a big red flag.
Anyway, Moskopolis is still a fine place. And indeed, we shouldn’t overreact to an increase a murder. But if the mayor says murder isn’t up, perhaps you shouldn’t believe the mayor.
Brennan has a new report out showing murder down 2.5% nationally, but there are some major issues with that finding.
1) The figures cited aren’t year-to-date, they’re projected year end numbers based on around midyear counts.
2) Murder tends to pick up over the second half of the year, and any projection using midyear numbers will almost certainly be wrong.
3) They found murder -2.5% but included San Fran’s 2016 count in that. There was no count for 2017. Removing SF makes murder -1.5%.
4) Detroit is estimated to be -27%, but that’s based on Detroit’s open data site.
5) That’s problematic because the open data site is slow to add murders, so any year-to-date count will be wrong.
6) Detroit had over 130 murders as of late June according to the Detroit Police Department, and the 220 murders they project would be the fewest there since 1966.
7) Taking Detroit’s inaccurate count out takes murder in their sample from -1.5% to +0.7% overall. So Detroit’s inaccuracy explains the drop
8) The Phoenix count is similarly wrong. Phoenix had about 150 murders in 2016 but this report says they had 80 and project 60 for 2017.
9) The Phoenix figure was reached by using MCCA midyear data and doubling it, but Phoenix only reported Q1 data to the MCCA.
10) As of May Phoenix had 58 murders year-to-date in 2017 and 56 in 2016. Take away Phoenix and Detroit and suddenly murder is up 1.2% in the sample.
11) Which is to say nothing of the methodological issue of projecting midyear for 30 cities to a full year and calling it a national trend.
12) For what it’s worth, my midyear piece for @FiveThirtyEight shows murder up a few % but rising slower than previous years.
13) Also worth reading is @Jerry_Ratcliffe on why doing year-to-date analysis isn’t a great idea
14) Larger point is that measuring murder nationally is tough, drawing sweeping conclusions from badly incomplete data is a huge mistake in my opinion
This isn’t the first time the Brennan Center has released faulty and misleading reports on the rise in homicide. In July, after the last one, I finally made an attempt to talk to one of the report’s authors. Once I laid out my concerns, the correspondence ended. Today I asked the other author (via twitter) if he wished to be interviewed or engage in a civil discussion of methods. No dice, apparently he’s “alright, thanks.” It’s still an open invitation.
There are numerous problems with their analysis, but the most irksome to me is the straight-up misleading statement. I asked:
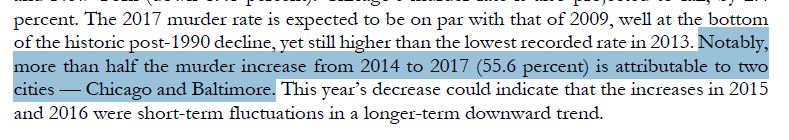
Is this statement [from your report] true? “Notably, 55.6% of murder increase 2014 to 2017 is attributable to two cities — Chicago and Baltimore.”
Because I know it’s not true, since about 14 percent of the murder increase from 2014 to 2017 is attributable to Chicago and Baltimore. He replied:
Yes. It’s true for the 30 largest cities (our cohort), not nationally.
This not an explanation as much as a confession because they don’t say “for the 30 largest cities (our cohort), not nationally” in their report.
I understand how they got their numbers; on my calculator, I can replicate their methods. That’s good, but not good enough. Their methods are faulty.
Here are some of my remaining unanswered questions I posted on twitter.
Since 2013, what is the change in homicides in those 30 cities? I get a decrease in 3 cities and an increase in 27. Is this correct?
Do you understand problems in saying a “percentage of increase in sample“? Substantively meaningless & statistically absurd.
If you have three years of data, why do 2017 tables only compare with last year, 2016?
It may turn out to be true, but still seems a odd choice that only mention of (20%!) 2-year homicide increase is as “short-term fluctuation”
If twitter can’t do this justice, I’d be happy to interview you for @QualityPolicing podcast.
I asked if we could “continue w/ a civil discussion of your methods?” Alas, the reply was: “I’m alright, thanks.”
For two main reasons, I’m not OK. I’d like the Left to stay committed to the truth. The generally decent Brennan Center should be above Heritage-Foundation-style BS.
But more importantly: when you say murder is down when murder is up, it’s not just an issue of truth. It’s also an attempt to make the murder victims — disproportionately poor young black men — disappear from our consciousness. As if they never existed. Do their lives not matter, too?