What’s wrong with the Brennan Center’s analysis? There are many problems. But here are a few:
1) They take a non-random sample (which isn’t bad in and of itself) and then A) don’t tell the reader in the text and B) state conclusions as if the sample were a random sample (every data point equal chance of being picked), representative of the nation.
2) They take short time frames (1 year) to point out that fluctuations could be random. True. For a short time frame. They could take a longer time frames (3 years) and see more clearly developed patterns.
3) This is bit trickier to explain. And that’s why I’m giving it another shot. They base their findings on a magnitude of changes within their sample. This has the perverse effect of attention getting conclusions — “more than half” — that are noteworthy only in direct proportion to the limitations of their sample.
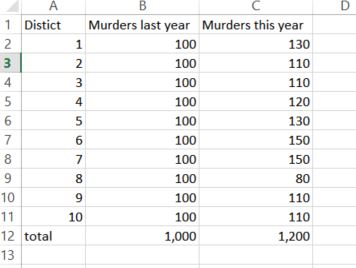
Let’s take an analogy. Say they want to look at murder in the City of Moskopolis (a fine city, despite a bit of a crime problem). So they take a sample of three police districts (out of ten equally sized police districts). Now it just so happens that we already know that murder in Moskopolis is up 20 percent. But our study looks at District #1, where murder is up 30 percent, and District #2, where murder is up 10 percent.
Now maybe District #1 is important for its own reasons. “Murder is up 30 percent in District #1.” No problem there. Or maybe, the mayor of Moskopolis prefers to give a bit of spin: “Murder is up 30 percent in District #1, but not so much in rest of city.” That’s fine, too.
But you can’t say this: “District #1 accounts for 75 percent of the murder increase in Moskopolis.” This is not true. It is false. District #1 accounts for 15 percent of the city’s murder increase.

So some guy who has a stick up his ass about accurate data (me, even though I really do have better things to be doing with my time) gets all huffy and points out this inconvenient truth to the Washington Post, which listens to me because I’m generally a trustworthy guy.
So the Washington Post calls the authors and says, “What’s up?”
“Oh,” they say. “I’m sorry. I was talking about 75 percent in my sample. Did I not make that clear?”
No. You did not. The Washington Post dutifully makes the correction and updates the story: “District #1 accounted for 75 percent of the murder increase in two districts.”
This is now no longer a false statement, but it’s a still meaningless one. Who cares about what percentage of change there is in one district in my sample? Why are we talking about two districts when we could be talking about six, eight, or even all ten of them. And here’s a doozy: What if murder went down in District 2? Could District #1 account for more than 100 percent of the increase in my sample? Mathematically, yes, says my calculator. But statistically an increase of 100 percent is absurd. Methodologically, this should be a big red flag.
Anyway, Moskopolis is still a fine place. And indeed, we shouldn’t overreact to an increase a murder. But if the mayor says murder isn’t up, perhaps you shouldn’t believe the mayor.
Comments
2 responses to “Still trying to explain…”
Finally.
With the FBI report, they have stopped pretending that there isn't an increase in homicides.
They are using the FBI uniform data comparing 2016 to 2015. And given that 2017 is not showing any major decrease, they are willing to concede a trend.
This report does everything but blurt out the answer.
urbanlabs.uchicago.edu/attachments/store/2435a5d4658e2ca19f4f225b810ce0dbdb9231cbdb8d702e784087469ee3/UChicagoCrimeLab+Gun+Violence+in+Chicago+2016.pdf
They still can't *difinitively* explain it. Of course.
Two things.
First … It is reasonable to point out an outlier. However, it isn't reasonable to put too fine a point on it. You have 10 districts. An overall increase and modest decreases in 3. The seven that increased are over 100% of the increase. You have to allow for vanilla variance. At some point you are simply saying that the increase is due to the districts that increased partially offset by the districts that decreased.
And if you refer to outliers, you need to do a little more than say they aren't representative of the overall decline in crime since the crack epidemic and then act like it is a huge mystery why Baltimore and Chicago are the outliers. We saw Baltimore on Television, after all.
Secondly ….
The Brennen Center is hopelessly entangled with asserting a political position. I'm fine with it, but they need to decide on whether they are simply an advocacy group or are interested in research. They have decided, I suppose. But they are very invested in arguing that crime is decreasing and it isn't clear that any data will change their mind.
The FBI and the Washington Post decided that the 2016 Uniform Crime data means that homicide and violent crime increases seen in 2015 weren't simply a 'blip'. We also know 2017 will not show much of a decrease. Which means the question regarding the sudden increase in violent crime within a long term secular decline needs to be addressed.
I took a look at their website and I wouldn't bother arguing with them.