So last night I listened to a online discussion with Bill Bratton and Connie Rice. Bratton, you probably know, is the former police commissioner/chief of the NYPD and LAPD. Rice graduated from Harvard and NYU Law and is a civil rights attorney, activist, and a former member of President Barack Obama’s Taskforce on 21st Century Policing. That last part matters. Because that report is taken seriously by a lot of people as a vision for progressive police and a blueprint for reform. (Though I’ve never been a big fan.) The discussion was OK. But I really couldn’t focus on much after this moments 22 minutes in. Ms Rice says:
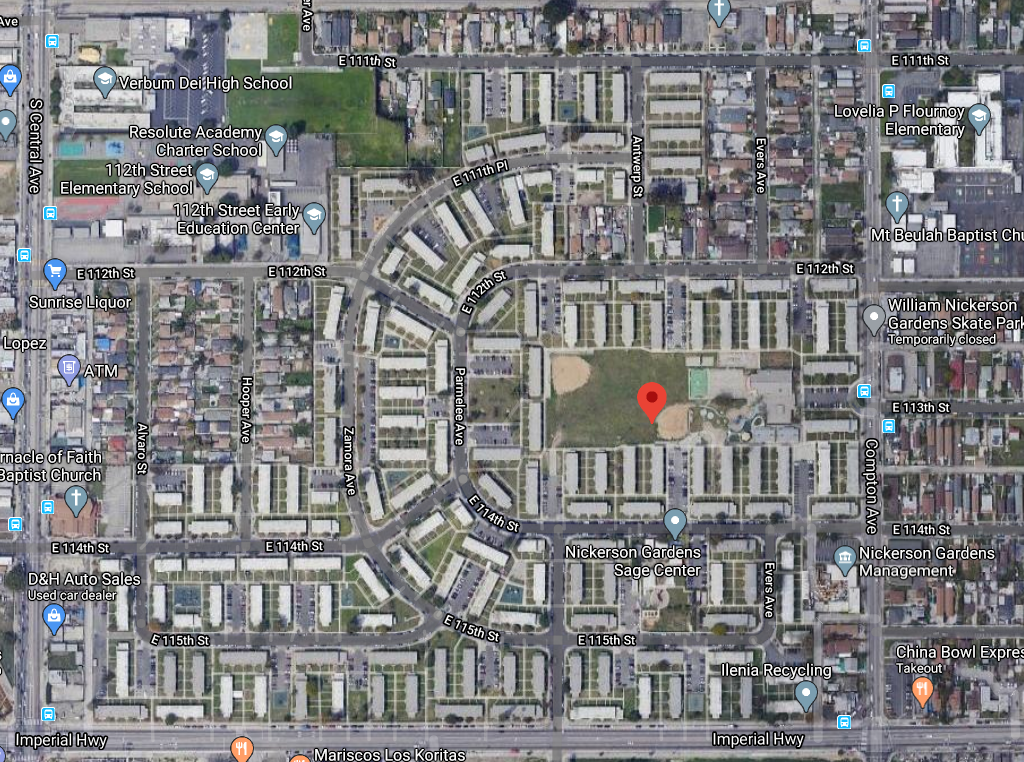
I’m just going to say this one stat once. If you’re a black man in Nickerson Gardens, today, every time you step out of your unit in that housing project, you face a 45% chance of going to jail. Every day. Not being stopped. That’s 90%. That’s what mass incarceration has done to these communities. That’s not safety, that’s destruction. … We’ve got to stop that aggressive proactive preemptive policing that criminalizes the entire community.
But there’s no way 45% of black men going outside are locked up every day. No way. There’s no way 90% of black men are stopped every day. It’s impossible. How can one with common sense think this to be true?
If there’s a police-related epidemic right now, it’s an epidemic of crazy talk about policing. Not from anti-policing people or somebody at a protest. I’m talking about professors, writers, lawyers, people who impact police reform and policy. People who really should know better.
Last month I was bothered when a respected professor proposing that the NYPD was playing fast and loose with shooting numbers. Then Jill Lepore wrote an article in the New Yorker based, in part, on the belief that a majority of 18-to-34 year-old men admitted to hospital emergency rooms go there because they were beaten by police or security. It can’t be true and it’s not. And if you think it might be true, well, you’re ignorant. And then it’s hard to take your opinions seriously on anything else related.
But maybe Rice misspoke. It happens. I know Bratton heard her. Maybe he blinked. But Bratton is so smooth you don’t even see him flinch. So we’ll let it slide, we will.
Rice: I also know in the communities where George Floyd come from, the police have helped to destroy those areas. When you have mass incarceration rates, when somebody can’t walk out of their unit, without facing a 45% chance of going to jail that day? Houston, we’ve got an enormous problem.
This time Bratton jumps in, politely:
Bratton: If I may, Connie, I’m intrigued by that figure. You’ve used it twice now, that 45%, 90%, where did that come from?
Rice: It comes from Dr Raj Chetty, who is an economics professor at Harvard. And he does a report called “Zip Code is Destiny.” … Nickerson Garden Housing project is so big it’s its own census track. And he delved down into the dynamics and the multivariate regression analysis. He isolated what’s the risk of going to jail every day if you’re a black man between 18 and 25. He speaks math, Bill. You and I can’t read his equations. But you can’t knock down that study. It’s rock solid.
“Rock solid”? To me that’s like saying “I double dog dare you!” And, oh, pardon me, I do speak math.
Here’s a “back of the envelope” way to figure out how crazy Rice’s belief is. Nickerson Gardens is 1,066 units of public housing with a population of around 5,000 (I’m making an educated guess on the latter). There are probably ~1,400 black men in Nickerson Gardens. The employment rate for black men in is 48% (Opportunity Atlas, track 06037242600).
So let’s just imagine, as Rice must — that in this police state where men get stopped as soon as they leave their (as she strangely puts it) “unit” — imagine there’s such a fear of the destructive police state that no black man in Nickerson Gardens ever leaves his home except to sneak off to work. We know that’s not true, but even with that absurd assumption, where half the men never leave their house, at least 700 black men must leave their “unit” every day. If 45% of these 700 get arrested, that equals 114,660 arrests a year, just from Nickerson Gardens, population 5,000. But here’s the thing, the LAPD made a total of 90,143 arrests in 2019, for of all of Los Angeles, population 4 million.
Here’s a not so sensational video (as these things go) of life on the streets of Nickerson Gardens. You know what you don’t see? You don’t see cops stopping 90% of men. You don’t see cops arresting 45% of men. Quite frankly, you don’t see cops.
But, I mean, I go into this knowing Rice is wrong. The only question is “how?” (Though what really bothers me is “why?”)
Raj Chetty is probably best know for his Opportunity Atlas, which documents how much of life outcome can be predicted simply by where you grow up. This is good and important stuff. Now I don’t think Raj Chetty (nor anybody else) has written a report titled “Zip Code is Destiny.” I could be wrong. But there’s “The Opportunity Atlas: Mapping the Childhood Roots of Social Mobility.” There’s nothing about 45% of men being arrested.
44.1% of black males growing up in the poorest (bottom 1%) families in Watts* were incarcerated on April 1, 2010. In contrast, 6.2% of black men who grew up in the lowest-income families in central Compton were incarcerated on April 1, 2010.
* there’s an odd footnote here:
This particular statistic is for a tract in Watts that contains the Nickerson Garden public housing project. For convenience, we refer to tracts by neighborhood names in this paper, but quote statistics from specific tracts within those neighborhoods
I don’t know why you’d choose to do that. Why say “Watts” and “Compton” if you mean one track in Watts and Compton? But what matters for me is they’re taking about incarceration, not arrests. But 44% is still too high. It just is. What gives?
The Opportunity Atlas shows a 7.1% incarceration rate (and a 71% poverty rate) for Nickerson Gardens (both sounds true). And for black men, incarceration is much higher (28%). But the 44.1% Chetty et al reference is only for black men from the lowest 1% of household income, less than $3,300 a year in Nickerson Gardens. If there are 1,400 black men in Nickerson Gardens. 1 in 100 means 14 men. Statistically this gets odd. Yes, maybe 6.2 of these men, statistically, are in prison. But that’s not my point.
But I’m curious how “44.1% incarcerated” transfers into educated urban myth about arrests and a false narrative of racial injustice and over-policing. In February Rice wrote an op-ed in the L.A. Times advocating that the LAPD get rid of their gang database:
45% of black men who grew up in the Nickerson Gardens housing project were incarcerated on one particular day.
Still not true (also not corrected). But hell, the real figure (28%) is still too high. (But so is the rate of murder.) Regardless, Rice is talking about incarceration, not arrest. Now in Rice’s defense, Chetty himself said this in 2018:
CHETTY: On a given day. On a given day — the date of the 2010 census, 45 percent of the black men who grew up in this tract in Watts — it’s called the Nickerson Gardens public housing project. Forty-five percent of them are incarcerated.
But it’s not what his own research shows. He’s kind of muddling the lowest-income part. It’s sloppy, but it’s also a radio interview and having done a lot, I cut him some slack. Here is his greater point:
CHETTY: Here’s maybe something you didn’t know, though. If you go a mile or two away, to Compton, you see that rates of incarceration for black men growing up there in families of comparable income are something like 6 percent. So still actually high — 6 percent is not a small number. But relative to 45 percent, it’s dramatically lower.
See, that’s good stuff. But maybe Chetty doesn’t realize how low his n (number of people in a sample) is here. But it’s his study, and I don’t want to cut Chetty too much slack, because, his verbal errors, as they say, always seem to lean “in the same direction.” I don’t like that.
A fair listener, perhaps even Connie Rice, might think Chetty said 45% of black men in Watts are in prison because that is what Chetty said. He really should make clear he’s talking about the poorest 1% of the population, which is a statistically dubious category for a census tract. (Also, as a side note, who in the world but an economist believes the reliability of self-reported household income data, in Nickerson Gardens, for the poorest 1%? Are you kidding me?)
Anyway, somehow Rice went from hearing a false but understandably misconstrued take on the incarceration rate and turned it into an absurd statement about the probability of arrest. Again:
Rice: Every time you step out of your unit in that housing project, you face a 45% chance of going to jail. Every day. Not being stopped. That’s 90%…. Somebody can’t walk out of their unit, without facing a 45% chance of going to jail that day.
Wow, if that were true, my opinions on policing would be quite different than they are. As to the 90% of black men stopped by police every time they leave their “unit”? I don’t know. It’s also not true. But maybe it comes from some lifetime chance.
Look, I don’t expect everybody to read every study. I don’t expect everybody to be informed on every issue. But I do ask for some basic common sense.
Here’s the thing: Connie Rice is no kook, she’s an educated and respected authority of the law and policing. But you wouldn’t listen to a flat-earther talk about global circumnavigation. You wouldn’t listen to an anti-vaxxer’s opinion about the latest clinical COVID vaccine trials. So why do we listen to misguided people speak about policing? It’s not good for reform. It’s not good for race relations. It’s not good public safety.
Justin Nix has a good article (academic, but plain English and not behind paywall) about the dangers of using cops-killing-people as a variable. He writes in response to an article by Schwartz and Jahn that maps “police violence” across U.S. metropolitan areas. Schwartz and Jahn find, as have I, that
Rates of police-related fatalities varied dramatically, with the deadliest MSAs (metropolitan statistical areas) exhibiting rates nine times those of the least deadly. Overall rates in Southwestern MSAs were highest, with lower rates in the northern Midwest and Northeast. Yet this pattern was reversed for Black-White inequities, with Northeast and Midwest MSAs exhibiting the highest inequities nationwide.
Not that I’m cited or anything — though granted this blog is not a peer-review publication — but I do believe I was the first to observe and try to raise the issue of state and city disparities in police use of lethal force back in 2015 (and everyyearsincethen). This was after the Washington Post and Fatal Encounters starting keeping a reliable count of those killed by police (starting in late 2014, after Michael Brown was killed in Ferguson). My goal has always been to have others do more thorough statistical analysis, so I’m happy it’s finally getting some attention.
What Nix does is raise some very serious and legitimate issues about what can be gained from this kind of analysis. Not to say one shouldn’t look at those killed by police, but any conclusions need to come with much larger caveats.
Nix’s first issue, however, is with Schwartz and Jahn’s term “police violence” (this and all subsequent quotes are from Nix):
Use of the term “police violence” has the potential to mislead readers who believe that police use of deadly force is rampant and usually unjustified (e.g., those who view police as “vigilantes” or “oppressors”). It also has the potential to drive away readers who understand how statistically rare police use of deadly force is, and that it usually occurs in response to violence (e.g., police officers themselves, and those who view police as “professionals”).
We in the field tend to use “police use of deadly force.” Why does this matter? Because, as Nix says, “‘police violence’ assigns all responsibility to officers, as if none of the citizens involved contributed in any way to the violence.” This contributes to a certain anti-policing narrative. But also “police violence” groups incidents in which police need to use deadly force together with incidents in which police shouldn’t have used deadly force. If cops shoot a shooter actively killing people, it seems a bit unfair to focus on the race of the shooter as causal factor.
But there is a more serious statistical problem with using police-involved killings as indicative of deadly-force situations. The problem is that “killed by police” is not a reliable and instructive variable even with regards to deadly-force encounters with police! And given that US police have literally hundreds of millions of interactions with people, fatal shootings are really rare (about 1,000 per year).
The number of times in which police might use deadly force (pointing a gun at somebody) and the number of times police do use deadly force but do not kill (more on that, later) far outweigh the times somebody is shot and killed. So we’re studying a very rare phenomenon, extreme outliers, while also missing most of the cases of exactly the phenomenon we’re trying to study.
The numerators of Schwartz and Jahn’s fatality rates are a nonrandom sample of all deadly force incidents that occurred from 2013 to 2017. To be sure, there is some degree of chance in whether a person who is shot lives or dies (e.g., whether bullets pierce a vital organ). But part of the variation across MSAs both in terms of rates of police-involved fatalities and racial disparities therein might be driven by nonrandom factors apart from police behavior. [italics added]
That’s serious, if your focus (or blame) is on police behavior. When people, myself included, compare fatal police shootings in, say, Las Vegas, Nevada, and St. Louis, Missouri, we’re assume that fatal shootings represent the number of times cops shoot people. But that’s not the case. At least in the limited cities we do know about. In some given time frame, Las Vegas police killed 47 people while St. Louis PD killed 20. So it seems like Las Vegas police shoot more than twice as often as St Louis police. But both police departments shoot just as often. The Las Vegas fatality rate (chance of dying after being shot by cops) is 41% while in St. Louis it is just 17%. And this doesn’t begin to take into account police-involved shootings where cops simply miss. (I’d guess, very roughly, based only on the NYPD concept of “object completion,” that that may be somewhere between 10% and 20% of the incidents in which police shoot.)
Similarly, based on people killed by police, Boston and Atlanta seem to shoot the name amount (not rate, just number). But in reality Atlanta police are 3 times as likely to shoot. The fatality rate after being shot by a cop in Boston is 71% while Atlanta is 24%. Why are these rates are so different? Distance to good trauma care is a proven factor, but that can’t be the only one. And we don’t have national data on this.
This is the “numerator” problem. We’re studying use of lethal force and don’t know how often it happens. Sure, being shot and killed is proxy. But how good of a proxy is it? We don’t know. Hell, only for the past 5 years do we know the number of people cops kill. So we’re forced, like it or not, to use the best data we have, the data we have rather than the data we want. Is this good enough? That’s the question. And Nix makes a good argument that the answer is “no.”
The third of three issues raised by Nix is about the “denominator.” Or, to put it another way, “Yes, the use of force is disproportionate… but compared to what?”
One can only be subjected to police force—including deadly force—conditional on interacting with a police officer in time and space. So how informative is it to calculate police-involved fatality rates for a population that is mostly never at risk? … A Venn diagram of the “at risk” and general populations would not perfectly align—instead, the “at risk” circle would be a small circle within the much larger general population circle. Perhaps some comparisons to other phenomena are in order. To estimate maternal mortality rates, researchers do not include all women in the denominator, but instead the number of live births. … To estimate the rate at which sharks bite people, researchers would need to determine who goes into the water. Studies concerned with police use of deadly force must be equally attentive to identifying a meaningful denominator.
In any given year, most people have zero chance of being killed by cops. Why? Because they don’t interact with cops in that given year. If we’re looking at individual police as a source of bias, it doesn’t make much sense to include those who don’t interact with cops. The Bureau of Justice Statistics estimates that in one year about 20% of Americans over 16 had some sort of contact with police.
We know there are racial disparities in policing based on — in addition to any active bias on the part of police — 1) people who call 911, 2) victims of crimes, 3) criminal offenders, and 4) traffic stops. And numbers 3 and 4 are related to 5) disproportionate police presence and activity in high-crime neighborhoods. We do not have reliable data on the rate at which cops interact with people. And even then, all interactions are not equal. Context matters.
The available evidence indicates that both crime reporting and proactive police stops differ systematically across racial groups. … Is the solution to ignore this mediator—which is literally a necessary precondition for being killed by a police officer—and calculate rates for the entire population (most of whom are never at risk)? If the goal is to understand and improve officer decision-making as a way to save lives, then I am not convinced. Stopping a person and using deadly force on a person are two different decision points, with different antecedents, and need to be analyzed as such.
Yes, as we like to say: it’s complicated. Comparing racial disparity to overall population figures does has its use. It describes, well, police use-of-force on a given population. But it does not explain the police part of use-of-force.
To be clear, there is nothing inherently wrong about Schwartz and Jahn’s use of population denominators in their analysis, so long as readers bear in mind there are many factors (including police behavior) that drive the disparities. I am merely pointing out that it produces rates that are not all that helpful in understanding why police-involved fatalities vary across space as they do.
If we are to move beyond shock and outrage that there are racial disparities in police use of lethal force — if we are actually going to reduce the number of people killed by police — we need to understand the “how” and “why” as much as the “what.”
Full citation: Nix J. (2020). “On the challenges associated with the study of police use of deadly force in the United States: A response to Schwartz & Jahn.” PLoS ONE 15(7): e0236158. https://doi.org/10.1371/journal.pone.0236158