[Warning, this is a whole lot of nothing-burger in the end. But still, for those interesting in crime data, it might be worth reading.]
Shootings are up so much in NYC that social scientists are left accusing the NYPD of “juking” the stats. Now I’ve been using NYPD data for a long time and compared to, well, every other source of data I’ve every used, NYPD data is pretty damn good. Seriously. They are smart people there and they care about data quality. Doesn’t always mean the data going into the system is right, but the NYPD really does care about the quality of their data. (Now if only they would make more of it public…)
That said, even with NYPD data, I still only trust murder and shooting data. Not because of intentional manipulation as much as knowing how tricky it is when data goes into the system, and how tricky it can be to get reliable input. Much less if precinct commanders actually are trying to juke the stats
What this means is that educated people are saying it’s entirely possible — likely even — that violence isn’t really up. That instead NYPD is making up data. I actually find this preposterous when it comes to NYC shooting data. But hey, who knows?
In fact, says one good professor, one shouldn’t even write about the increase in violence. Denial is always the first stage in social science when it comes to changes in crime. It will move on to framing and confusion very soon.
Anyway, if NYPD is trying to artificially inflate shooting numbers, that’s a new one. Of course, maybe they somehow hid away shooting victims last year and every year for the past many years. I doubt it, but it’s possible.
Now the people who actually analyze this very data provided some pretty good answerrs, but it fell like water off a duck’s back. (To wit: current homicide numbers are lower because some injured people haven’t yet died; this month last year had an unusual number of non-gun homicides.) Anyway, the gist being, “Are you effing crazy? No, we haven’t changed anything. Shootings last month really were triple the year before!”
Honestly, to accuse professional crime analysts, people who do this for a living, to accuse them of conspiring to lie about data is a pretty big accusation. Especially when your only proof is, “Shootings can’t be up that much without a greater increase in murder.”
But still, I was led to gun violence archive (GVA), which I’ve never used, as potentially a more accurate source than NYPD data. And this even though some of their data collection seems to be based on little more than tweets put out… by the NYC Alerts911.
So I thought I’d spot check some data. At the time I’m typing this, I haven’t actually checked yet! For real! So this could go either way… but my money is on NYPD data. But still, this is exciting (well, to me, and actually not really).
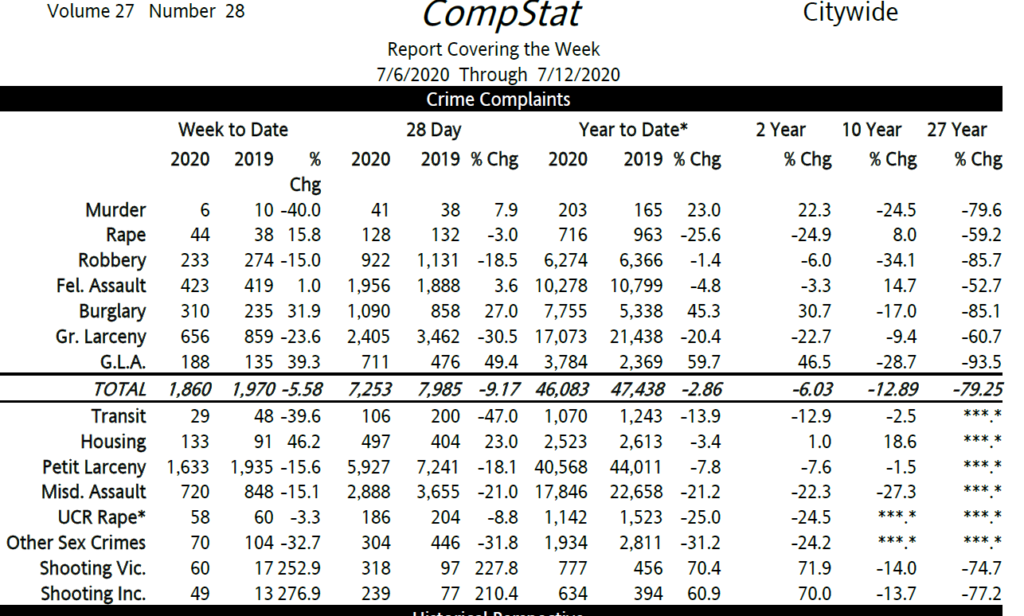
I’ve decided to spot check the week July 6-12, mostly because I downloaded the PDF of the official NYPD Compstat data for that week. (NYPD does a horrible job of releasing data. And were they to release more data , in a good form, it would so help the NYPD [echo echo echo]. It’s just frustrating because I could have saved a day of my life if this data beyond a goddamned 1-page PDF were public. Why isn’t it?)

So that’s the NYPD data. I’m going to focus only on the 2nd from bottom line, Shooting Vic. That means people who took a bullet. Now I also happen have the actual list of every shooting and murder victim in the city, which isn’t public. It should be. But it allowed me to check the internal validity of the public Compstat page, above.

60 shooting victims. 7 murders, one of whom was not shot. 6 shooting murders. Does that match with the pdf? I hope so. [checks] Bingo! Well, there is one more murder, 7 vs 6. But that doesn’t bother me. The Excel file I have is more up to date than the PDF, so I presume one of the victims died after the PDF was put out. It happens.
Now this just proves internal consistency in the NYPD. There could still be a big conspiracy.
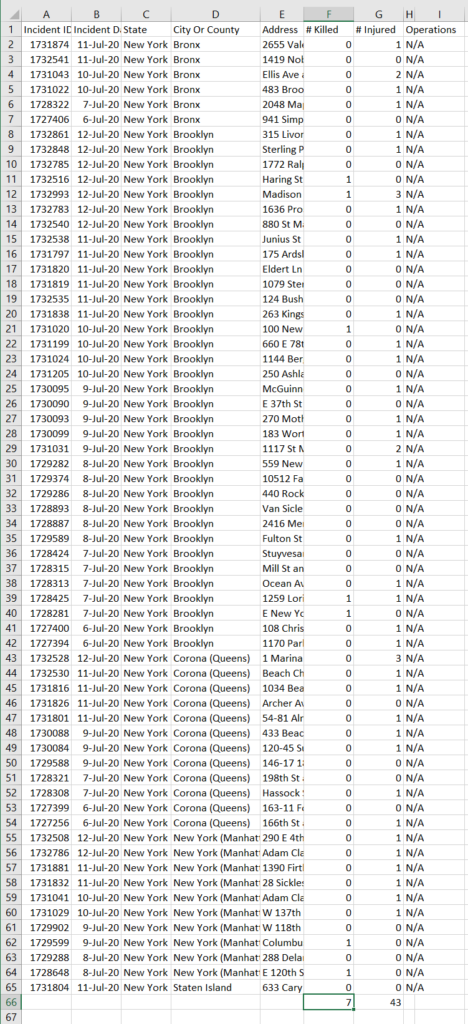
Now let’s look at the Gun Violence Archive for this same week in 2020. They show 7 murder victims shot and killed and 50 people (43+7) shot.

(By the way, it bugs the hell out of me that every place in Queens is listed as “Corona (Queens).” Corona is one neighborhood in Queens. Doesn’t really matter, but it’s a yellow flag for sloppiness.)
Now let’s shift to 2019. According to the NYPD Compstat page from this year (above), there were 17 shooting victims and 10 murders in 2019. (I do not know if the weeks will line up perfectly.) Let’s see…
According to the internal data I have, there were 17 shooting victims and 11 murders. Maybe 1 of those died this week? Maybe they’re off by 1. Either way, it jibes. Of note is that 8 of these murder victims last year were not shot (3 were killed by arson!).
NYPD 2019, week of 7/6 to 7/12:

This helps explain a lot of why shootings are up so much more than murders this year. In 2019 there were only 3 shooting deaths during this 28-day period. (Those were the days!) And there were 3 deaths for 17 shootings. That means 18% of those shot died.
This year only 1 murder wasn’t by shooting. There were 7 deaths out of 60 shootings: 12% (a notable difference from 18%–one that needs explaining, but not one that is unexplainable–one that could be expected if there’s more people shooting semi-randomly into crowds).
Now going to GVA for this same week in 2019. (This omits all non-shooting victims.) (Also, I want to gripe that GVA is a shitty website because it doesn’t allow me to download more than 501 cases at a time. So this took awhile to download everything from Jan 1, 2019. Grrrrrr. It also doesn’t allow to filter by locations easily. Or at least correctly. So I downloaded for all of NY State month by month, combined, and then manually took out everything that isn’t NYC. I have better things to do with my life. Or maybe I don’t?)

3 murders and 20 (17+3) shooting victims. (I don’t know what it means when they list an incident without a victim, but whatev.) This is three more shooting victims than the NYPD counts. That’s… interesting. Why the discrepancy?
July 6: “GVA” has 4 victims; NYPD 3.
July 7: GVA has 2; NYPD 3.
July 8: GVA has 6; NYPD 4.
July 9: 1 and 1.
July 10: 3 and 2.
July 11: 2 and 1.
July 12: 2 and 3.
Some of these might be shootings that happen around midnight. Or maybe not. So as research I’m thinking let’s spot check a few days. July 10? I’m using GVA for the link to source. Definitely 2 people were shot. But the third? “Reports of” are very different than a person actually shot. Probably didn’t happen. But GVA counts it. Because there were “reports of.”
On July 6 GVA lists 4 victims. NYPD 3. But one of them listed by GVA, it turns out, wasn’t a shooting victim. He was pistol whipped, according to the NYPD. Could by lying… but no.
Here’s a crazy idea: What if @NYC_Alerts911 isn’t the most reliable source of data. And what if NYPD crime data actually is reliable? Crazy, I know. But I’ve been doing this for years. And it’s what I’ve found to be true.
Anyway, it comes down to this. For June 14 to July 12, 28-day period,
GVA lists:
2019: 85 people shot in NYC
2020: 265 people shot in NYC
That’s a 211% increase.
NYPD (which is more accurate):
2019: 97 people shot
2020: 318 people shot
That’s a 228% percent increase.
So there’s no great discrepancy. All this is because somebody carelessly analyzed the GVA incorrectly. Now I’ve wasted half a day confirming what I already know because the idea that the violence rise in NYC isn’t happening was gaining traction on Twitter. Frustrating. But that’s OK, I suppose. It’s good to confirm data. But it’s better to focus on the problem that more people are getting shot. And questioning the integrity of the good data distracts from that. That’s what pisses me off. Shootings are up in NYC. For at least the past 5 (6?) weeks; triple compared to last year. Triple! No, it’s not NYPD making up numbers. But I guess there’s always value in making sure one’s data is correct.
But seriously, for the day I’ve spent proving the obvious? Arguing if lives are really being lost? It’s just that I could have spent that time thinking about what we could be doing to actually prevent lives from being lost. That’s what’s frustrating.
My “pinned tweet” on twitter is this:

I wish I had added, “the stats are rigged” to #1. But today I saw somebody go down the list in order, through #1,#2 (though the year mentioned was 2010), #3, and #4. It’s frustrating. Because I’ve said why (at least as well as one can in 650 words).


Why don’t you trust GLA numbers? I would have thought that it would be very likely to be reported and recorded because of insurance rquirements and because it’s costly to the victim. With the increase at 60% surely something’s going on. Explanations?
GLA is probably third on my list of trusted crime numbers. Compared to many, they’re more reliable. Part of the problem with GLA numbers is simply that they went down so much — and for non-police reasons such as cars couldn’t be hotwired, chop shops were broken up, technology, and carjacking became a thing — I’m not certain what useful information they’re actually telling me. Also, I am suspicious of insurance fraud leading to false positives. Though I have no idea if that’s significant or not. In sum, I do sort of trust GLA numbers. I just don’t know how useful they are.
I must say that the statistics you mentioned are very impressive …
“Juking” the statistics of the shootings aside, I see no major reason on why to even mess with the statistics in the first place. Perhaps how you mentioned how they possibly hid shooting victims from the past few years and are trying to make up for it now. However, I don’t see that being a very easy and manageable task.
You also mentioned how you trust shooting a murder data because of how tricky it is to put in the system. Why is that not the same case with the shooting victims?