Over the past two years, homicide increased 31 percent in America’s 52 largest cities.

The cities range from little Richmond (220,000 people) to big NYC (8.5 million), from comparatively safe San Diego (homicide rate 3.5 per 100,000) to dangerous St. Louis and Baltimore (rates of 50+).
Collectively 50.5 million people live in these 52 cities, or roughly one-sixth of America’s population. Homicides increased 31 percent over two years (4,946 to 6,496, which is about 36 percent of all US homicides). 45.3 million people live in cities in which homicide rose; 5.3 million live in cities in which homicide decreased.
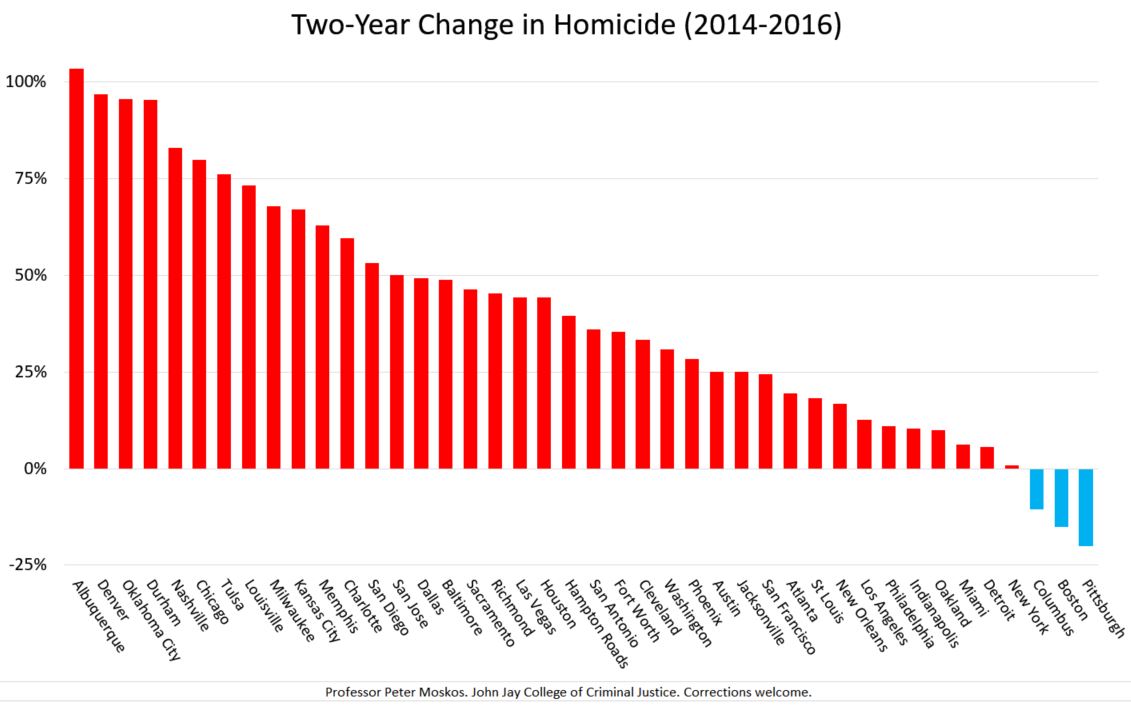
For graphic representation in the chart above, I removed cities with fewer than 40 or more murders in 2016 because a low n leads to overly dramatic year-to-year changes. This affected El Paso, Seattle, Portland, Raleigh, Omaha, Tucson, Wichita, Long Beach, Minneapolis, and Fresno. (I also dropped Bakerfield its 153-percent increase is either a crazy outlier or my numbers are wrong.) Of the 43 remaining cities, 39 saw homicides go up.
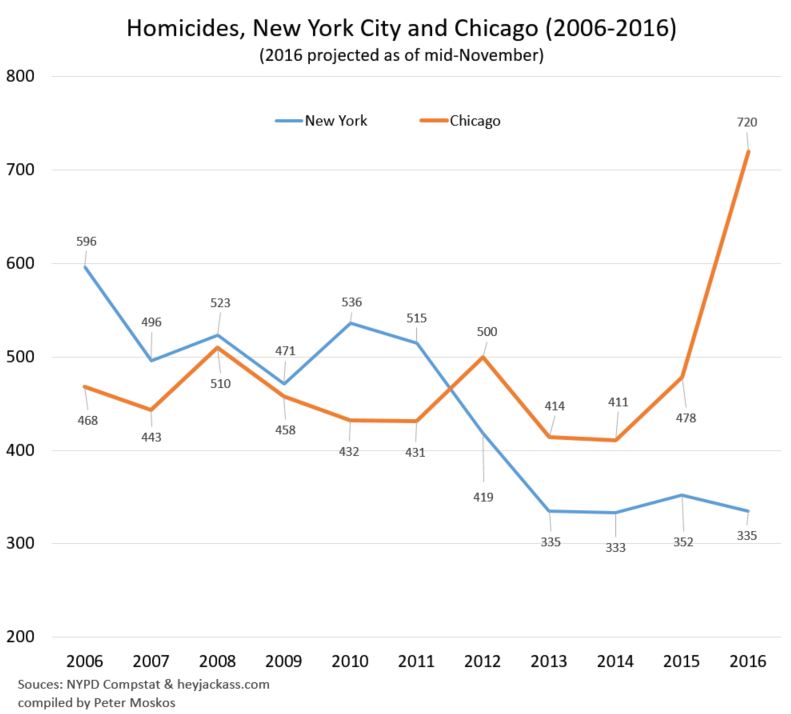
The cities that seem to be bucking the trend of greater violence over the past few years are Seattle, Portland, Fresno, Boston, Tucson, Columbus, and New York City. In terms of raw numbers, the cities with the largest increases in murders are Chicago, Houston, Baltimore, Memphis, Dallas, Milwaukee, Las Vegas, and Kansas City. Were one to take the eight cities with the biggest increase out of the equation — and there’s not any moral or statistical justification for doing so, but just for fun, because the Brennan Center likes doing this trick — the rest of the cities have a collective 2-year 20-percent increase. That’s 20 percent more than we’ve seen in a very long time. So, no. It’s not “just Chicago.”
Here are the top 52 cities and their two-year change in homicides, 2014-2016.
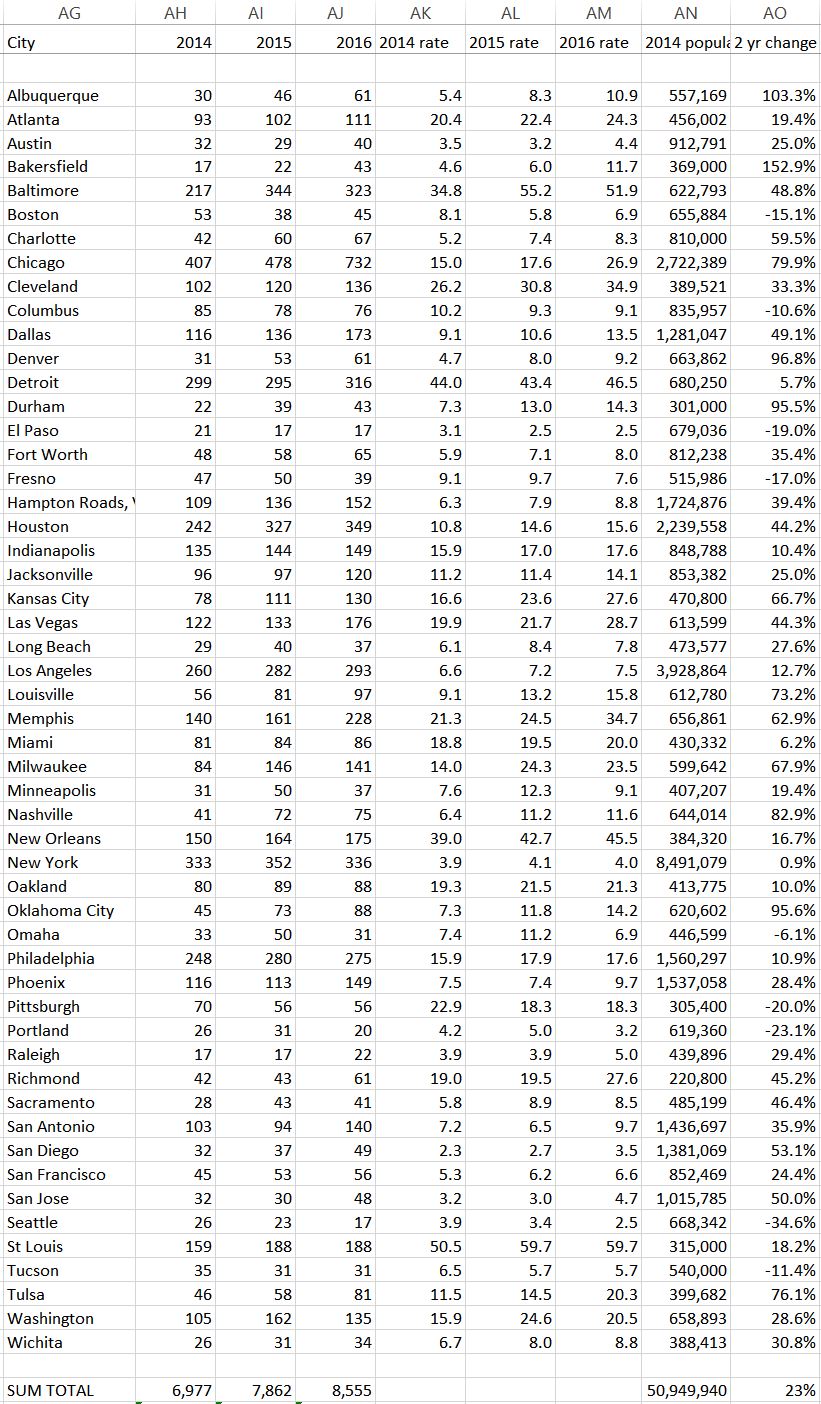
And the data in text form, for your cut-and-pasting needs. Albuquerque: +103% | Atlanta: +19% | Austin: +25% | Baltimore: +49% | Boston: -15% | Charlotte: +60% | Chicago: +80% | Cleveland: +33% | Columbus: -11% | Dallas: +49% | Denver: +97% | Detroit: +6% | Durham: +95% | El Paso: -19% | Fort Worth: +35% | Fresno: -17% | Hampton Roads, VA: +39% | Houston: +44% | Indianapolis: +10% | Jacksonville: +25% | Kansas City: +67% | Las Vegas: +44% | Long Beach: +28% | Los Angeles: +13% | Louisville: +73% | Memphis: +63% | Miami: +6% | Milwaukee: +68% | Minneapolis: +19% | Nashville: +83% | New Orleans: +17% | New York: +1% | Oakland: +10% | Oklahoma City: +96% | Omaha: -6% | Philadelphia: +11% | Phoenix: +28% | Pittsburgh: -20% | Portland: -23% | Raleigh: +29% | Richmond: +45% | Sacramento: +46% | San Antonio: +36% | San Diego: +53% | San Francisco: +24% | San Jose: +50% | Seattle: -35% | St. Louis: +18% | Tucson: -11% | Tulsa: +76% | Washington: +29% | Wichita: +31%
July 13 Update: A short while back I finally sent an email to one of the authors at the Brennan Center expressing my concerns about what I see as their deception. I received a brief reply stating, in part, “the statistics you cite [to wit: “Chicago accounted for more than 55 percent of the murder increase last year” & “A similar phenomenon occurred in 2015, when three cities — Baltimore, Chicago, and Washington, D.C. — accounted for more than half (53.5 percent) of the increase in murders”] refer to the increase in murders in a group of 30 cities that we study in our reports – not the national increase in murder.” I replied:
Thanks for replying. But these clarifications do not negate the basic mis-truth of the highlighted statements (which have been cited and repeated which clarification). As as academic, I do not understand this. It’s not enough to have the truth somewhere in a publication. The summary and abstract, especially when right beneath the title, need to be be accurate standing alone. Surely you understand that readers, especially journalists on deadline, may not have the time or statistical knowledge to parse data as I do. They read and quote the summary. And isn’t that what you want them to do? So these need to be factually correct.
Chicago simply does not account for half of the increase in “urban murders.” Personally, I would only feel comfortable saying “Chicago accounted for (roughly) 12 percent of last year’s homicide increase” (assuming a national increase of about 2,000). But since we have the two-year data, why not use it? I would feel more comfortable saying “Chicago is (approximately) 9 percent of the nation’s homicide increase over the past two years.”
You’ve chosen to highlight a large percentage (55.5%) that is large only because of the self-selected limitations in your sample size (“in this group of cities”). Taking a percentage increase within a limited sample is not correct. For instance, were we to look at just the top five cities (NY, LA, Chicago, Houston, and Philadelphia), one could say Chicago accounts for 95.5 percent of the total increase in urban murders. While mathematically true, this would be substantively meaningless if not downright misleading. Or, to further illustrate this point, why not just take the top three cities? The numbers would allow us to say: “Looking at the three largest cities, Chicago accounts for 102 percent(!?) of last year’s urban homicide increase.” Of course, the numbers come out this way, but one city accounting for more than 100 percent of an increase is both conceptually impossible and mathematically absurd. Does this make sense? The larger sample you use lessons the magnitude of the absurdity, but not the nature of its existence.
Were one to take a larger sample, looking at the top 50-plus cities, then Chicago accounts for 38 percent of last year’s increase. And 20 percent of the two-year increase. Were one to include all urban areas, of course, the percentage would be much smaller. But any arbitrary limit on the denominator is statistically dubious.
But back to my initial point — what is highlighted (and cited in the media) is right there is the lede/summary/subtitle without qualification — how is one expected to interpret, “Chicago accounted for more than 55 percent of the murder increase last year”? Do you think this is an accurate presentation of data?
Here our correspondence seems to end.
In addition to the UCR, here are some of my source. Corrections welcome.
https://www.abqjournal.com/923137/city-sees-highest-number-of-murders-in-20-years.html
http://www.kerngoldenempire.com/homicide-tracker http://www.city-data.com/crime/crime-Bakersfield-California.html
http://www.cleveland.com/metro/index.ssf/2017/01/year_in_review_homicides_surge.html
http://www.newsobserver.com/news/local/community/durham-news/article123339719.html
http://www.elpasotimes.com/story/news/crime/2017/03/23/rash-homicides-anomaly-police-say/99555590/
http://www.star-telegram.com/news/local/community/fort-worth/article128019874.html
http://abc30.com/news/domestic-violence-related-murders-rise-sharply-in-fresno-during-2016/1679846/
http://fox59.com/2017/03/02/early-2017-homicide-total-climbs-as-mayor-hogsett-stays-the-course/
http://jacksonville.com/homicides/2016
http://www.kshb.com/homicide-tracker-2016
http://homicide.latimes.com/neighborhood/long-beach/year/2016
http://www.miamiherald.com/news/local/crime/article104679101.html
https://projects.jsonline.com/apps/Milwaukee-Homicide-Database/
http://www.startribune.com/statistics-show-minneapolis-violent-crime-edged-up-in-2016/409711555/
http://www.nola.com/crime/index.ssf/2017/01/new_orleans_finishes_2016_with.html
https://oaklandmofo.com/blog/oakland-homicide-count-is-rising
http://dataomaha.com/homicides/2015
https://www.phillypolice.com/crime-maps-stats/
http://www.azcentral.com/story/news/local/phoenix/2017/03/29/maricopa-county-phoenix-area-homicide-map-2017/99735018/
https://newsinteractive.post-gazette.com/homicide/
http://koin.com/2017/01/01/4-of-portlands-20-homicides-from-2016-remain-unsolved/
http://www.kcra.com/article/meet-the-tiniest-deer-being-nursed-back-to-health/10247250
http://www.sandiegouniontribune.com/news/public-safety/sd-me-county-homicides-20170226-story.html
https://www.tucsonaz.gov/files/police/pt1_16_summarytable_0.pdf
http://www.kjrh.com/news/local-news/tulsa-homicides-in-2016-interactive-map-shows-location-of-homicides-during-record-year
http://www.sandiegouniontribune.com/news/public-safety/sd-me-county-homicides-20170226-story.html
http://wtkr.com/2015/12/22/norfolk-is-the-deadliest-city-in-hampton-roads/
[Posts in this series: 1, 2, 3, 4, 5, 6]