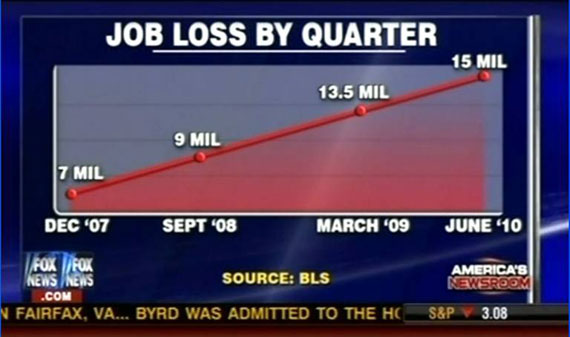
Fox News says an ever-increasing number of people are losing their jobs. 15 million alone in a 3-month period in 2010!
 That’s patently absurd. But it’s cited to the Bureau of Labor Statistics so it must be true.
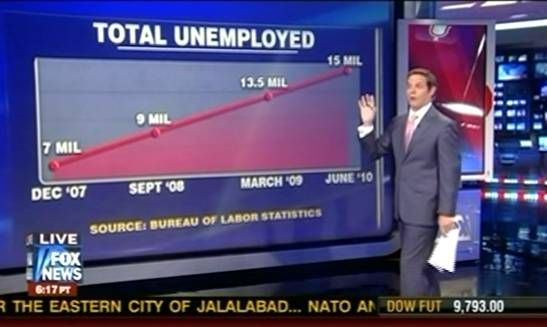
They “corrected” their graph to read: “total unemployed.”

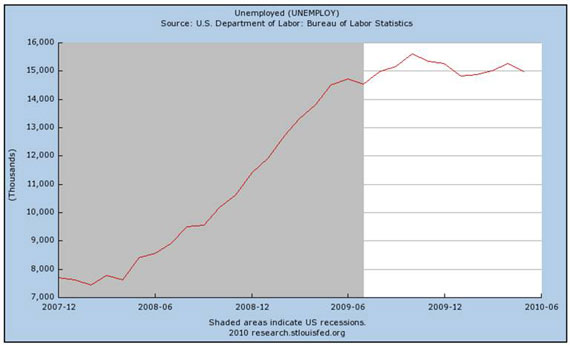
Straight up, I guess ever since Obama started handing out all that “Obama money.” And you know it must be true because this time they actually spelled out “Bureau of Labor Statistics”! The only problem is that unemployment is notgoing up. It’s been steady at 15 million since August, 2009.
And then look closer at their chart. Now there’s no law that says you have to write “not to scale” when your draw a graph that isn’t to scale. But common courtesy and a sense of decency would implore you to mention that fact. Otherwise, you know, people could draw the wrong conclusions. Hmmmmm…. Looks like they already decided and didn’t really report.
The line they draw is straight up and steady. But the numbers aren’t. The first increase is two million. The second increase is 4.5 million. The last increase is 1.5 million. The actually numbers look like this:
 But what are you going to be believe? The truth or Fox’s lying eyes?
[Taken from Media Matters, which has more details. And discovered through Jay Livingston’s always good Montclair SocioBlog (the best blog I bet you don’t read).]

You have pointed out that they oversimplified their representation of the unemployment situation. You are criticizing that they chose the first and last points on the graph without detailing the dynamics in between. The dynamics in between suggest that whatever the "Hope" campaign tried was entirely ineffective, as it coincided with a run up in total unemployment without mitigation until April '09 and has remained steady since then, i.e. the stimulus didn't stimulate diddly. You can fault for not pointing out that the crap economy wasn't constantly increasingly crappy, but don't try to pretend that the crap economy didn't have a positive and increasing crappiness, followed by a consistently crappy-constant malaise. That is what I see. Crap on Fox's poor statistical parade, but don't suggest that you have anything better.
Jack,
That was a crappy response to the professor's crappy nitpicking.
Thank you!
Actually if you fit the non-linear unemployment curve you show with a linear model (as they show), it looks pretty much like what you see on the TV broadcast. (BTW, unemployment from August 09 – ~Oct./Nov. 09 is NOT stable on your chart; not unless you call ~1-1.5 million jobs insignificant.)
Now, of course, they got the label on their chart wrong (Job Loss vs. Total Unemployed), but that sort of thing is kind of like…oh…a "teleprompter mistake"…you know, like the Bush-style one Obama (when reading Irish PM Cowan's lines) was so quickly forgiven for (read: never even criticized for) in 2009.
Just saying…you (the unthinking left) are just as biased as the unthinking right (e.g., Fox news) — neither of which I belong to.
Sorry, I meant "monotone nondecreasing" and "non-monotone" instead of "linear" and "nonlinear"