Recently I came across a breathless headline in Salon: “Number of fatal shootings by police is expected to reach 1,000 for third year.” That’s an odd way to put it because A) it implies the number has been at a record high the past three years when B) this is only the third of three years the Washington Post has been counting and C) it’s not true.
According to the Washington Post data they cite, there were 991 people shot and killed by police in 2015 and 963 in 2016. The more accurate headline, as see in the actual Washington Post is: “Number of fatal shootings by police is nearly identical to last year.” Well, that’s a bummer if one is trying to hype a crisis. Also “reach” is not synonymous with “approach.” But I’m not hear to quibble about the semantics of a few dozen deaths.
The number of those killed by police seems to be steady at just under 1,000 per year. But given the increase in homicide, it’s actually surprising the number killed by police hasn’t increased. When violence goes down, as it did in the 1990s, police shoot fewer people. When violence goes up, as it did in the late 1980s, police shoot more people. I suspect there are two variables pulling in opposite directions. One involves more violence in general — increasing police-involved shootings — and the other involves less police engagement and fewer interactions with citizens. Less proactive policing means fewer interactions and less that can go wrong (and also more crime).
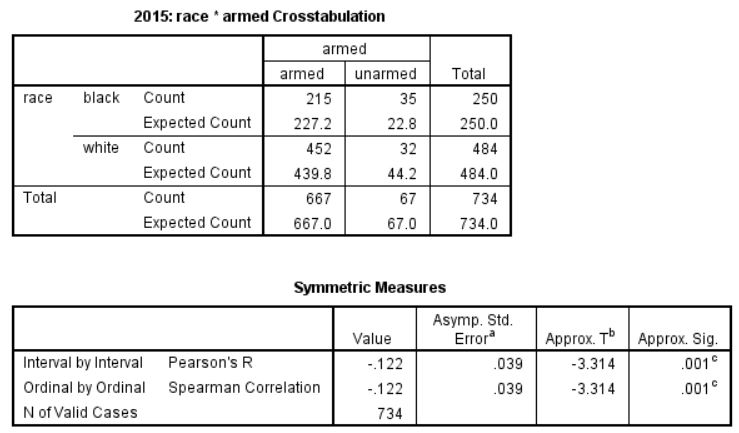
I looked at the Washington Post dataof those shot and killed by police in 2015 and 2016 and broke it down by states with more and fewer African-Americans. States that are more than 10 percent African American include 21 states plus D.C. (198 million people, 18 percent black, 36 million blacks). There are 29 states less than 10 percent African American (126 million people, 6 percent black, 7 million blacks).

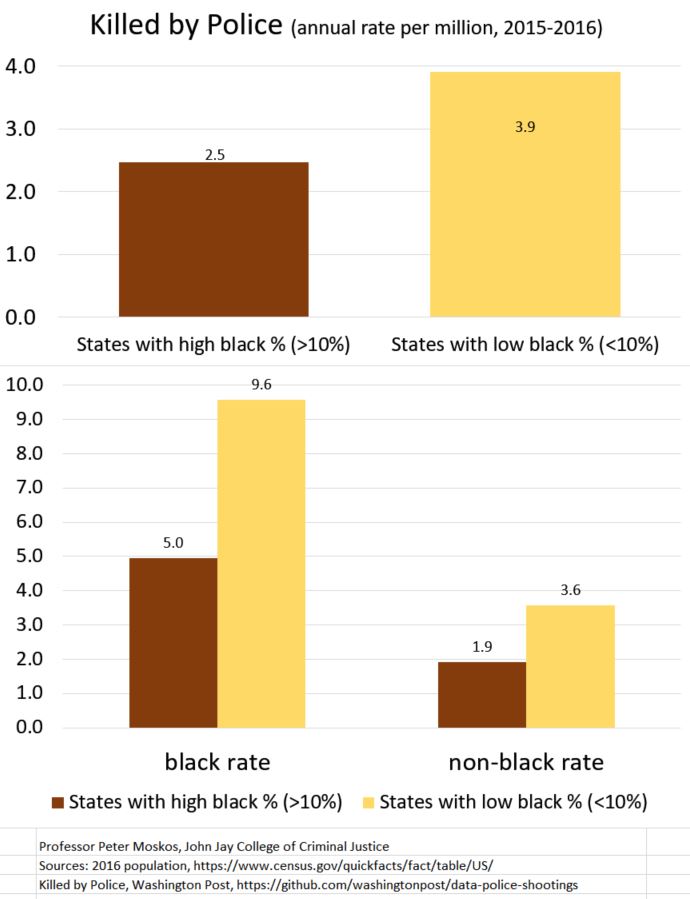
People, all people, are 1.6 times more likely, per capita, to be shot and killed by police in states that are less than 10 percent black compared to states more than 10 percent African American. Blacks are still more likely than whites, per capita to be shot overall. But this ratio (2.6:1) doesn’t change significantly based on how black a state is.
For both whites and blacks, the likelihood of being shot by police is greater in states with fewer blacks. And the difference is rather large. There are seven states less than two percent black. In 2015 and 2016, zero blacks were shot and killed in Maine, New Hampshire, Utah, Vermont, Wyoming, Idaho, and Montana. But if you think cops don’t shoot people in these states, you’re wrong. Compared to the four states with the highest percentage of African-American (Mississippi, Louisiana, Georgia, and Maryland are more than 30 percent black), the overall rate of police-involved killings in states with few blacks is higher. And this is despite a lower rate of overall violence.
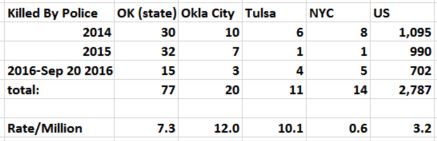
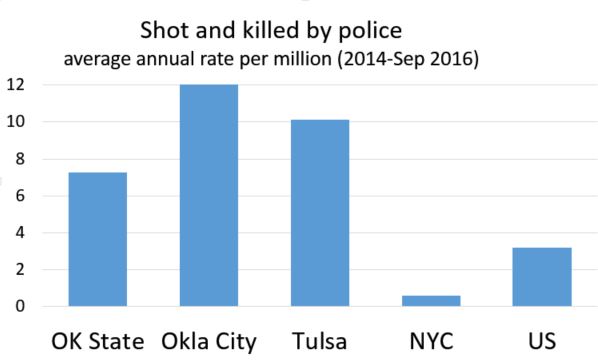
The implications of this are many, but for starters, if one wishes to reduce the number of people shot by police, it would make sense to focus on states that have more police-involved shootings in general. New Mexico, Alaska, Oklahoma, Wyoming, and Arizona have rates two and even three times the national average. Even though California ranks only 13 out of 51 (4.2 per million compared to 3.0 nationally), California is significant because it’s so large. In terms of reducing police-involved shootings, these are the low-hanging fruits.
Were the states with fewer blacks able to reduce their rate of lethal force to the level of states with more blacks, there would be an 18 percent nationwide reduction in the number of those killed by police. But this would require a move away from a general focus on policing and race toward a focus on police departments that shoot a lot of people of all races (particularly hispanics, it should be noted, and not examined here). Alas, at the intersection of police, race, and ideology, I’m not holding my breath.
And there’s a caveat: though state-level data is revealing, it’s often too general in terms of policy solutions. Intra-state differences are very large (and not examined here). Policing is local, and some local jurisdictions simply shoot a lot more peoplethan others. (That linked-to post is from two years old, but the basic points are solid).
Here are the raw numbers. As always, click to “embiggen.” Data available on request. Corrections welcomed. Strongly encouraged, even.

Sources: 2016 population, https://www.census.gov/quickfacts/fact/table/US/
Killed by Police, Washington Post, https://github.com/washingtonpost/data-police-shootings
Update July 17: Thanks to I.L., corrected and updated.
Update: 2020 caveat.