There’s an article in Criminology & Public Policy by Justin Nix, Bradley Campbell, Edward Byers, and Geoffrey Alpert that has gotten some press: “A Bird’s Eye View of Civilians Killed by Police in 2015: Further Evidence of Implicit Bias”
Although we could not determine whether officers were quicker or more likely to fire their weapon at minority suspects, we argue that if minorities were more likely to have not been attacking the police/other civilians, or [emphasis added*] more likely to have been unarmed, this would indicate the police exhibit implicit bias by falsely perceiving minorities to be a greater threat to their safety.
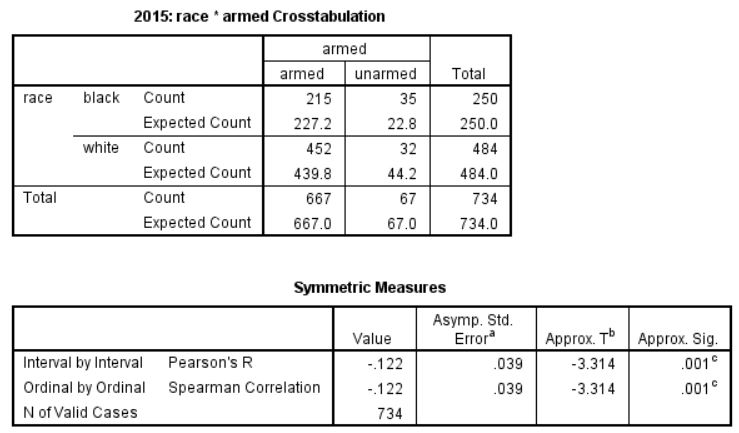
I replicated their data and got 93 “unarmed” suspects killed in 2015. (Replicating data should be a given, but often it is not. So kudos to the authors for this.) In 2015, 38 unarmed black men and 32 unarmed whites were shot and killed by police. If the distribution were proportional to all those shot and killed, one would expect 24 blacks and 46 whites killed. This is a statistically significant difference. From this, the authors conclude “Black civilians were more than twice as likely as White civilians to have been unarmed.” Twice sounds big. The absolute number? Not so big. Still, if you’re one of the 38 unarmed black men killed, it matters.
Here’s armed versus “unarmed” by race (for whites and blacks), for 2015 [click both to “zoom” and “refine”]:

I also looked at “threat level.” For 2015, I get what the authors get:

You can see that for the threat = “other” (Ie: non-attack, in theory), one would “expect” to find 49.9 blacks in that square (if race wasn’t a factor). But in reality 63 blacks were killed. That’s a big and statistically significant difference.
[I’m limiting the presentation of my analysis (as is my wont) to percentages, crosstabs, and univariate correlations. If one can’t describe statistics to a lay-person, it all becomes too abstract. And a problem with doing advanced statistics is then most people don’t understand what they mean (and that includes most academics). And so then the reader has to take the scribe at their word.]
[Also, I have serious non-trivial issues with categorizing “other” as “non-attack,” but I’ll leave that aside, until my next post. Also, for replication purposes, I too exclude “undetermined” threat level (n = 42), but I don’t think one should. More on that in the next post.]
Here’s where things get interesting! Unlike the authors, I can publish this in seconds and, for better and for worse, not wait for peer review (though corrections and comments are always welcome).
So with the click of a button on SPSS (a statistics program), I can include 2016 data and even 2017 data right up to February 8 (when I downloaded the data).
Here’s what I get when I do their analysis on threat, but for 2016:
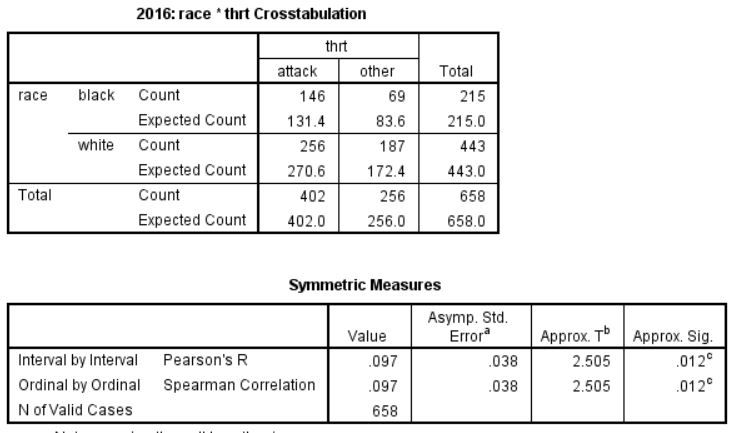
Compared to 2015, in 2016 the results are reversed. This is a big deal. There are fewer blacks in the “other” threat level than one would expect. And the results are equally statistically significant.
A similar things happens when one looks at armed and unarmed (again, I think this is too simplistic of a division, but that’s what they use).
Here’s armed versus unarmed by race, for 2016:
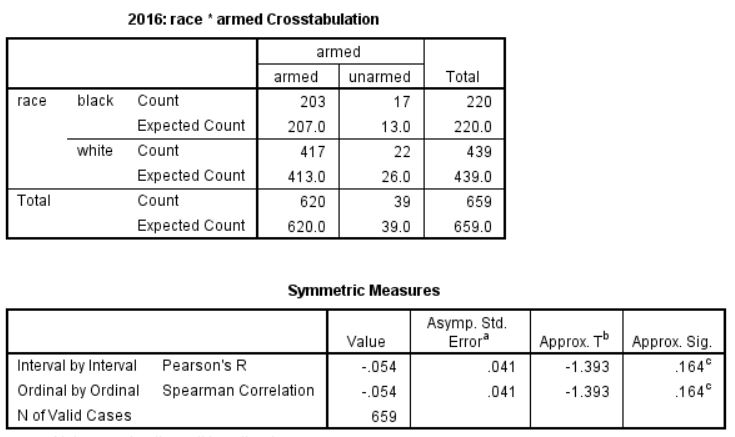
While the data isn’t completely reversed, the differences in 2016 are minor enough (and the “n,” the number of cases, small enough) that the racial disparity is no longer statistically significant.
What gives? Did the problem of racial disparity in police-involved killings disappear last year? Did it even reverse? I don’t know. But replicating the 2015 study with 2016 data would lead to a very different conclusion.
Here are some other interesting tidbits.
• From 2015 to 2016, total shootings deaths by police went down from 990 to 963. Given the increase in homicide, I would have expected the number of police-involves shootings to go up (they are usually correlated). I suspect that the number went down because A) given the focus on the issue of police-involved shootings, cops are less likely to pull the trigger and B) the number of discretionary interactions between cops and criminals has decreased.
• From 2015 to 2016, killings of unarmed people dropped from 88 to 49. The drop was most pronounced among blacks (35 to 17).
• Twenty-five percent of those killed by police are known to have pretty major mental health issues. This is a Big Red Flag. No doubt the real number is even higher (undiagnosed mental health issues among the poor, or simply a family that doesn’t want to tell a reporter about it). Implicit racial bias might (or might not) contribute to a dozen or so deaths. Mental health issues contribute to 250 a year! You want to reduce shootings? Provide mental care for people who need it.
• Seventy-eight percent of 2015 killings (This if from Nix et al.I haven’t recoded the 2016 data) happened in the South and West (with 60 percent of the population). Again, if one wishes fewer people to be killed by police, best to focus where police kill a lot of people.
• We really need more data, not just on police involved killings, but on all police-involved shootings. A lot of people are shot and not killed. We know next to nothing about this. And we need to know the context of these shootings. How did they start? How many are initiated by a call for service rather than a police officer’s discretion?
• We really need to be concerned about unintended consequences of policy decision. Perhaps a laser-like focus on police shootings and police misconduct combined with lawsuits against proactive policing really have ended the racial disparity in police-involved shootings. If so, that would be great. It’s just as likely that a laser-like focus on police shootings and police misconduct combined with lawsuits against proactive policing have contributed to less proactive policing and an increase in homicide. (It’s hard to argue one without the other, though people will try. Oh, they will try.) Eighteen fewer unarmed blacks were shot and killed by police in 2016 compared to 2015. Meanwhile, 2,000 more were murdered, most of them black (using the Brennan Center’s estimate of a 13 percent increase in homicide).
It’s not crazy to see some connection between these two variables: less proactive policing could [ie: does] mean fewer police-involved shootings and also more criminal shootings. Is this the best we can do? Is this the trade-off we want? Can one or should one talk about the value the lives in this way? I don’t know. But since more people are dying (though fewer at the hands of police) these are things we need to be talking about.
• Also, the number of unarmed Asians killed by police since 2015: Zero (of 30 killed, total).
[* The use of “or” is interesting. The numbers are really low. Cops just don’t shoot many unarmed unarmed attackers. You can’t really do multivariate analysis on a few dozen cases. Given the number of people killed by police, you can’t look at racial discrepancies (statistically) when the person killed is not-attacking cops and unarmed.]
[comments are (only) available on the next, related, post.]