[See my previous posts 1 and 2 and about NYC.]
It’s not unreasonable to believe — even when one knows the vast majority of police-involved shootings to be justified — that three police-involved homicides per day is perhaps two too many. Can the number of police-involved killings be reduced without placing officer’s lives in danger? Of course. We know this because some departments shoot a hell of lot more people than other departments.
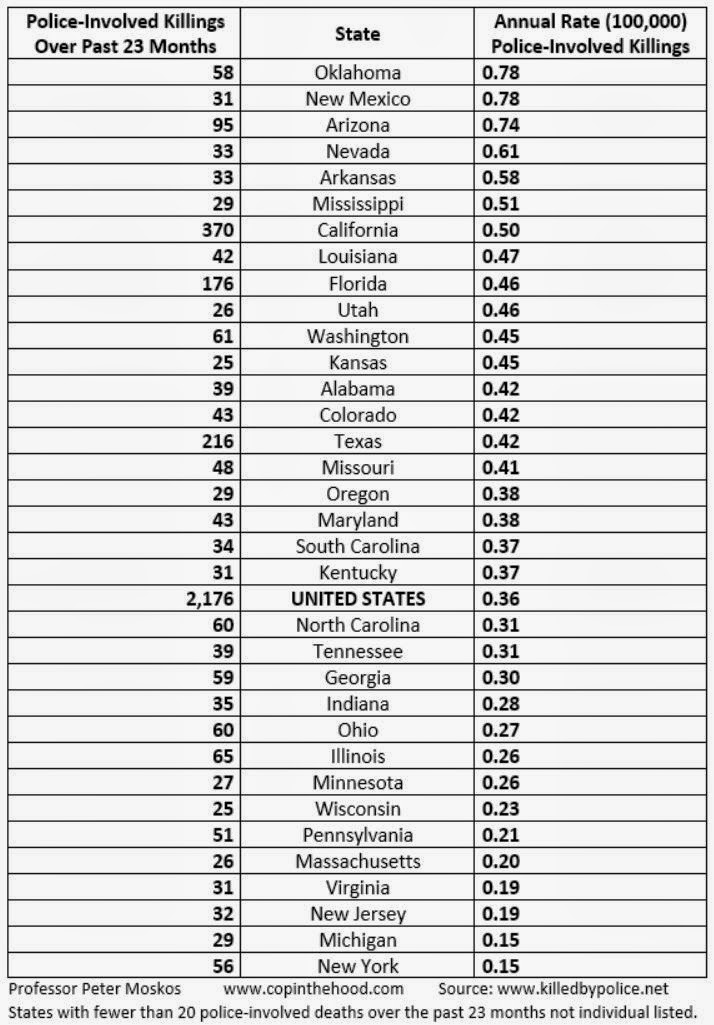
If California could reduce their rate of police-involved shootings down to the rate that already exists in the state of New York? 135 people a year would by killed by police. And that’s just in California alone.
Police in some states are much more likely to pull the trigger than in other states. Now this does not take crime and violence against police into account, which would in an ideal world. But the differences are still incredibly stark. And since we’re looked it states rather than cities, I mean, it’s not like cities in New York, New Jersey, and Michigan normally come to mind as epitomizing peace, love, and non-violence.
[It’s worth warning and repeating that all this assumes the data is valid enough. I am assuming that. But I may be wrong.]
Oklahoma has a police-involved homicide rate of 0.78. That’s higher than the overall homicide rate in Sweden. Oklahoma, New Mexico, and Arizona all have rates of police-involved killings that are twice the national average (0.36) and four to five times higher than Pennsylvania, Massachusetts, Virginia, New Jersey, Michigan, and New York.
My guess is the differences have to do with better training, more police officers per capita, less public tolerance of police-involved killings, higher police standards and pay, and differences in police culture.
But really, in terms of police training and standards, there’s no reason to think we couldn’t bring all states in line with the best states. And if police across the nation killed just as often as police in those least trigger-happy six states currently do? That would cut the national rate of police-involved killings by half and save 500 lives a year. This would also save 500 cops a year from having to shoot and kill somebody. Police lives matter, too.

Comments
14 responses to “Killed by Police (3 of 3): Cutting the number in half”
It is an interesting question — and perhaps should be approached as a loss prevention/risk management exercise or statistical quality control.
KBP includes deaths which are clearly accidental — squad car runs over pedestrian or police officer killed in shooting range accident by another police officer. Also, there are some health related deaths that seem unlikely to have been caused by the LEO. The point being that maybe 10% is just going to happen and doesn't really correspond to what the public is really concerned with.
And maybe another 10% where someone armed and shooting is a best practice. Like the guy in the New Orleans Airport.
That still leaves 80% to drill down on. I think you identified the easiest thing to address — geographical concentrations of high rates of KBP's.
Knife incidents, car chases and domestic disputes could also be analyzed.
I don't really know, other than to speculate.
Oklahoma has 77 counties, and half of them probably have no KBP's in a 4 year period.
However, more data is good. And perhaps the Hawthorn effect could help. You have seen the signs where worksites say something like 127 days without a loss time injury. The number of workplace deaths have gotten really low. An amazingly small number of roofers die every year, considering how many there are and how dangerous some of the roofs they work on are. And this doesn't attract the most safety conscious people in the world.
Anyway, the approach you are working on which initially focuses on gathering good data and working from that is really good.
Maybe some place like Riverside or Tulsa don't even realize that they are outliers.
Also, reframing the situation is good. If police get defensive about the negative publicity, especially from social media and feel like it is making their lives more dangerous, it will be harder to get a lot of support for this.
But the personal impact of a policeman killing in the line of duty is hugely negative, and a lot of possible changes might make thing much safer for police.
Have you seen this excel spreadsheet?
docs.google.com/spreadsheet/ccc?key=0Aul9Ys3cd80fdHNuRG5VeWpfbnU4eVdIWTU3Q0xwSEE#gid=0
Seems to me that an easy first step to reducing the number of persons killed by police is to get a good handle on what is actually happening. Require all LEAs to report the details of every officer caused homicide to some federal agency that then analyzes the data and writes an annual report. Include information such as whether the person was armed, what kind of weapon, was the suspect mentally ill, race of suspect, etc. I'd think that give a much better picture of why so many more people are killed by California police than New York police.
What I would like to see is a database of civil settlements/judgements against law enforcement for excessive force. Since the standard is "preponderance of evidence" rather than "objectively reasonable", it would help understand the problem better and also incorporate non-lethal brutality.
I had not seen that excel spreadsheet. Thank you. Very good stuff, I think. It has city data, which I love. And seems to synch well enough with killbypolice.net. Is it the same group? Who's behind it? Or is there some website linked to it? How did you find it?
It is the same group. I think, anyway.
Just reading through it, it seems like maybe 1/3 of the victims are severely mentally disturbed. They include deaths when someone fleas from police and then shoots himself. Or one woman jumped off a 30 story building. You could't make it up.
I think the data is pretty good. And it is dirty enough to be very convincing. There are some text fields that make it clear that it is hard to get everyone and every situation into categories.
It has opened my eyes to the possibilities of crowdsourced datasets.
"It has opened my eyes to the possibilities of crowdsourced datasets"
I'll say!
Though I do wish somebody would tell those motherfuckers to put just one variable in each column!
I just spend the past four hours figuring out how to change "date and description" to "date" and "description."
It involved me entering this into a Word find and replace field:
"([0-9]@x[0-9]@x[0-9]@):(*qqq)"
I am a wildcard king! (and a big nerd)
So do you think that means that they only trust they data since April, last year? Otherwise why wouldn't it be on killedbypolice.net?
To answer my question: yes.
They only seemed to get the system down in 2013. Their numbers are very small before them.
You know what's funny (at least to me), I guarantee you the data is compiled by people on the west coast.
Just from the numbers in a data set, I can see a west coast bias.
Peter …
Yea .. it is clear that they started in 2013, so they have about 2 years, but only one full year. 2014 .. I think it is complete, and will check.
As far as the data, it will need to be thoroughly scrubbed to do analysis using the additional fields. Although race is very good, in my opinion, as well as state. If you have some good geo coding software, you could use census tract numbers, or at least eyeball it.
i put it in Excel and have found the data isn't that bad to edit.
You can sort by data element and find the alternative variable names used, and edit from that.
I am working on Oklahoma. 65 rows.
A hell of a lot of gunshots. A handful of bad shootings — sketchy bad. But they do seem to haul them into court.
I want to work on one state and see where that goes.
I have never seen data where you can just hyperlink to a primary source – to the extent that the media is accurate.
Before you do any more work, I have the the stuff in workable columns
"I just spend the past four hours figuring out how to change "date and description" to "date" and "description."
Peter:
Maybe we are looking at a different dataset.
That column is just the date column description column and news article concatenated. .
The date and description field is
=CONCATENATE(G2, ": ", O2, " ", Q2)
It is there in separate columns.
I'll have to look again, but from my work last night, there was a date column, but it was the date the thing was entered and not the date of the incident.
The latter was together with the description.
The latter was more useful because (along with being the date of the incident) it is the date that is used at killedbypolice.net