Inspired by some twitter threads — mostly this onewith Gary Cordner and this onewith Andrew Wheeler — I thought I’d look more at the cops getting killed as a factor in cops killing people.
I like presenting this stage of research. In part because coming up with ideas and hypotheses and basic number crunching is what I like doing most. (I’ll leave the journal article submitted and advanced stats to others.) I’ll explain my steps partly to help others, but also to help me go through this on the old assumption that if you can’t explain it to others clearly, you don’t really understand it yourself. (I used Excel and PSPP.)
I’m always partial to fewer better-data over more bad-data. So, as I often do, I’d like to stick with good old murder: officers shot and killed on duty (from the officer down memorial page, which over the years I’ve found close to faultless, which is more than one can say for the UCR or anything else.)
The problem (from a statistical not a moral sense) is that there are many states in which very few officers are killed. So I went back to gather 20 years of data (for no particular reason, just a choice, it could have been 10 or 30) and got the number of officers killed between 1999 and 2018, by gunfire, for each state. 50 states. 990 total deaths. I dropped the states where n < 10. That leaves 33 states. Texas and California top the list, which isn’t surprising because they’re big states. But then come Georgia, Florida, and Louisiana. Interesting…
But what’s the best denominator? I mean obviously one needs to look at population to get a rate. But which population? In order, I’m going to consider 1) number of cops, 2) population levels, and 3) violent crime levels, 4) population density, and 5) percent of population that is African American.
1) Perhaps we should look at cops killed in terms of how many cops there are in any given state, so as to consider the chance of any given cop being killed on duty. Makes sense to me, the problem is that the official data even on how many cops there are looks dodgy. It seems unlikely to me, for instance, that Mississippi went from 5,222 cops in 2007 to 2,524 in 2014 (the two years anybody attempted to count, but reporting is voluntary). If I don’t trust the data, I don’t want to use it. But I still did the numbers, based on the average between 2007 sworn officers and 2014 sworn officers.
For presentation purposes, let’s use the USA average (using all 50 states) as a baseline, set that to 0, and compare all the states:
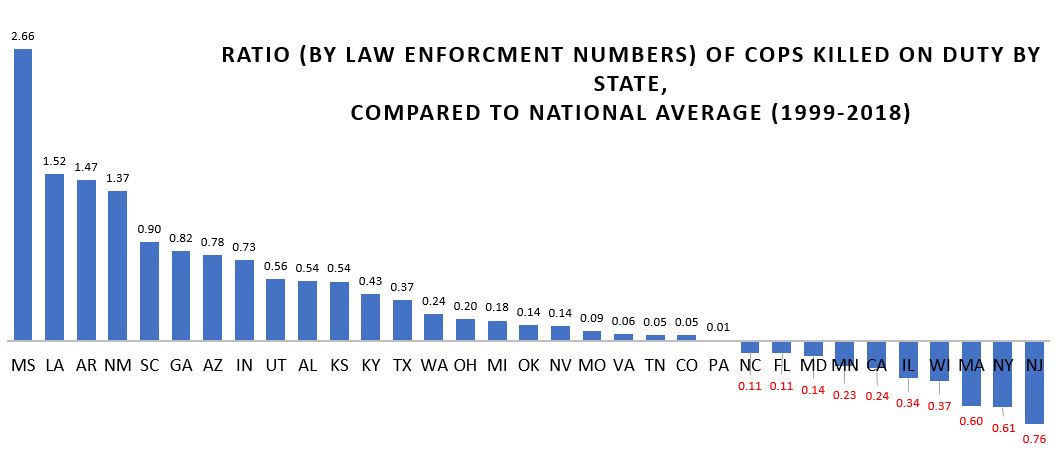
Cops are more likely to be killed in MS, LA, AR NM, SC, GA, and AZ. Keep in mind the small and safe states have been removed from the calculation. I don’t like this. If nothing else because I don’t trust the Mississippi numbers.
2) So let’s just use overall population as the denominator. I’m using 2016 population because that’s what I already have in my file. Some states have grown a lot in the past 20 years. Oh, well. I don’t think it matters that much for these purposes. If it does, we can consider it later. Keep in mind these are ratios, the actual numbers by themselves are meaningless. But as a ratio, yes, a value of 1 means a cop is twice as likely to be killed per capita. It does appear that a cop in Louisiana is about 4 times as likely to be shot and killed as a cop in New Jersey.
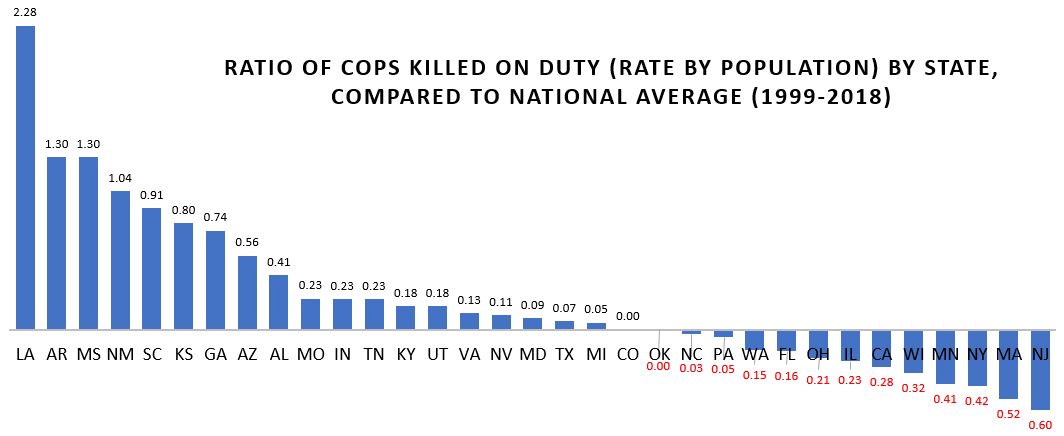
This says that Louisiana, by far, is the most dangerous state to police in. Arizona is next. And given that its population has grown drastically in the past 20 years, it should really be higher. And that would make LA seem like less of an outlier.
New Jersey, Massachusetts, and New York are all comparably safe. I won’t say the safest because the 17 safest (and smallest) states have all been dropped for the statistical reason of having fewer than 10 cops murdered over the past 20 years.
I think number 2 (population) is better than number 1 (number of cops). But they’re not drastically different. You get the same states on top and the same states on bottom. But I’m going with state population as the denominator because I don’t trust the count of cops.
3) Now let’s consider violent crime as an independent variable (which is the variable that affects something else, on which something else is dependent). And back to using all 50 states.
I just got some crude numbers off wikipedia and then took an average of 5 years of data for each state. (Not the best methods, but probably accurate. Certainly fine for preliminary work.)
Let’s run some correlations. I like correlations because they’re easy to understand. They also tell you where you should look for deeper answers.
First question: at the state level, is violent crime rate correlated with cops getting killed? Absolutely (Pearson Correlation = .62, Sig = .000). This is a strong and unsurprising relationship.
Next, at the state level, is violent crime correlated with being killed by cops? Surprisingly, technically, statistically, no. (correlation = .23 sig = .104) Not at the state level; not with an N of 50. Now I know from other research that violent crime is correlated with being killed by cops, but you’ve have to delve down into the neighborhood level to see that effect. But still, if it that doesn’t come out at the state level, it’s a clue that something else is also at work! This is where things get interesting. Something else is also at play on a state level that is more significant than straight-up levels of violent crime.
4) What about geographic area? This is where wikipedia is great because you can get state size in seconds. And then if you already have population and you’re handy with cut-and-paste and sorting on spreadsheets, you can get population density in minutes.
And it turns out the population density is indeed correlated with a lot.
Lack of density — more space — is correlated with being more likely to be killed by cops. Think of what this means. Common sense tells you it’s not a view of “big sky country” that makes cops shoot someone. Whatever really matters, is correlated to density (or lack thereof). Maybe it’s single person patrol. Or the time for backup to arrive. Or meth labs. Or gun culture. This is why they say “correlation doesn’t equal causation” (which is also the most frustrating phrases in social science, because correlation can very much indicate causality, and the phrase is often used to dismiss meaningful correlations as meaningless.)
Population density (lack thereof) is also correlated with cops being killed. Density is not at all correlated with crime (like not even leaning in one direction). And yet both crime and density are heavily correlated with a lot of other factors. And both are correlated with cops being killed. More crime = more cops killed; more density = fewer cops being killed.
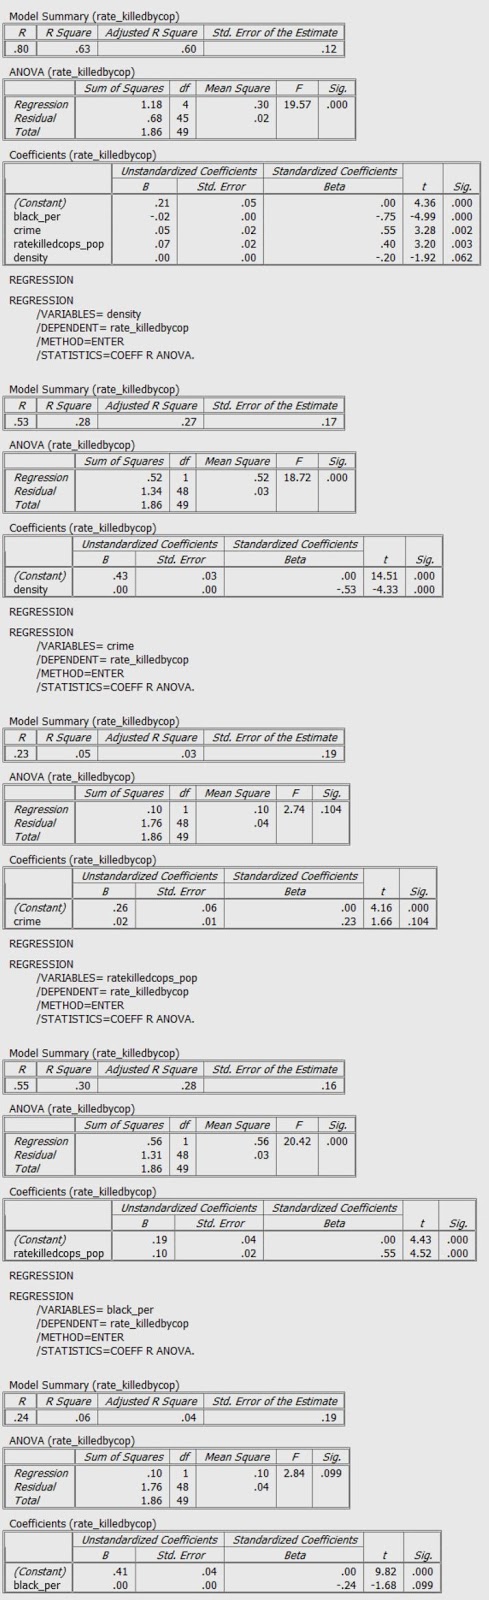
So now lets do a brief multivariate analysis, which is about as far as I go. This means that we look at more than variable at the same time. Which is more important (plays a greater role) in cops being shot and cops shooting people? Crime or density? (Or something else.)
Density seems to be more predictive than crime in terms of cops killing people and less important in terms of cops being killed (though for the latter both are correlated).
When I move “cops killed” to the independent variable side and keep a focus on people killed by cops, density becomes less important and violent crime becomes more important. This makes intuitive sense. Because the issue with a spread out area is that cop, alone, would face greater threats.
Keep in mind the above is about cops being killed. Much more talked about (by non cops) is people killed by cops. I wrote about that a few days ago.
If you’re still with me, kudos. Causes here’s where the whammo happens!
Were one to only look at individual variables, the key would seem to be density followed by crime and rate at which cops are killed. But it turns out that much of what is measured in those variables are simply correlated with and less important than the percentage of black population in a state. Crime matters. Police being killed matters (independently of violent crime), population density may matter a little, and of course other variables that I’m not even looking probably matter a lot. The question is always if they can be identified and accurately quantified.
Last year I observed that cops shoot more often in states that have fewer blacks. So I already had a strong hunch to look in this direction.
When one puts the state’s percentage of African-American residents into the equation, things start to fall into place. This is also taking into account how often cops get shot, crime, and density (which finally starts to lessen in importance — because as we know is only indicative of other factors — but still probably important in terms of gun laws and culture and police-backup).
If one considers crime, density, and black percentage — but only when one does so all together — all three are significant (with an R-squared of .55). When one adds the rate at which cops are killed, r-squared goes up to .62.
[R-squared is technically the distance (squared to take account of negative numbers) that data points are from the trend line of a chart. At some level, r-squared is supposed to indicate how much of what is being looked at is explained by the independent variables in the statistical regression. But that’s more in a statistical sense than a real-world sense. Still, generally, other things being equal, a high r-squared is better than a low r-squared. And an r-squared of 0.63 ain’t shabby for this kind of game.]
So what does all this mean? Density matters, but not so much for what it is but for things correlated with it (same could be said for race). All these variables have “intervening variables,” the way people act, the choices they make, the factors that make us do what we do. Things that may be harder to measure than crude indicators like “population density” and “race.”
Still, looking a these variables, density seems mostly to correlate with the lack of African-American in a state. The black percentage of a state seems to be the most significant factor in determining how many people are shot and killed by police (with overall violence and cops being killed also being important). But, contrary to what many people believe — and basically all of the “narrative” of the past few years — the relationship is inverse. The greater the percentage of blacks in a state, the less likely cops are to shoot and kill people.
This is counter-intuitive to a lot of people, particularly if you think cops only shoot black people. But it makes perfect sense if one thinks about it in two parts:
1) Whites don’t really care about who police shoot; period; end of story. And without the pressure over bad (or even good) police-involved shootings, cops never learn how to shoot less. Other things being equal, cops simply shoot more people if there isn’t any push-back from (to over-generalize) blacks and liberals and media and anti-police protesters. Call it the Al Sharpton Effect, if you will. Basically, in many places, police organization and culture do need to be pressured into changing for the better.
2) Police can be recruited, trained, and taught to less often use legally justifiable but not-needed lethal force less. The state variations in police use of lethal force are huge. Some states (and particularly jurisdictions within states) do it better than others. Instead of saying “police are the problem” we could look at the states and cities and department that are doing it better and learn.
Ultimately what we need are well and better trained police officers who shoot less often, but still shoot when needed.
I’ll leave you one final bit of data. I don’t know if there’s a there here or not. My guess is this does matter. But maybe it’s just a clue that leads to the above. Or maybe it’s something else. Maybe you can figure it out.
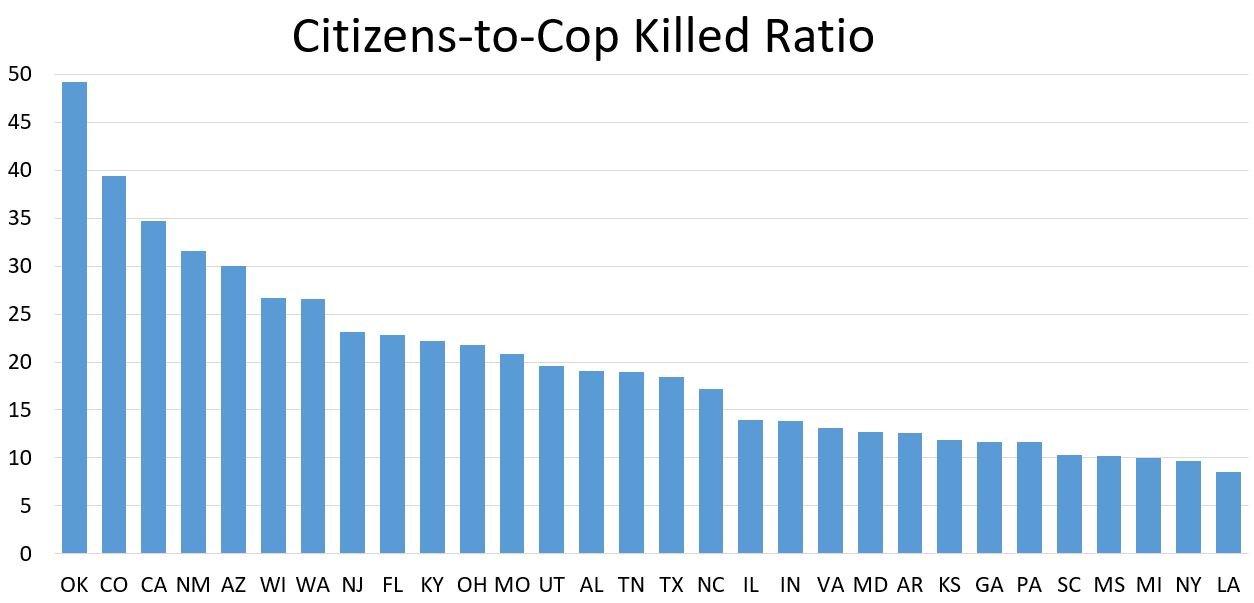
This is a table that shows a simple ratio: the number of citizens killed for each cop killed. Good people can debate what this ratio should be. I don’t want to go there. The correct ratio is no cops getting killed and few criminals getting killed. But what’s interesting to me is the that there is such a large difference between the states, and by a factor of 10! By and large the states on the high-end (more citizens getting killed) are very white and the states on the low-end (fewer citizens getting killed) are disproportionately black.
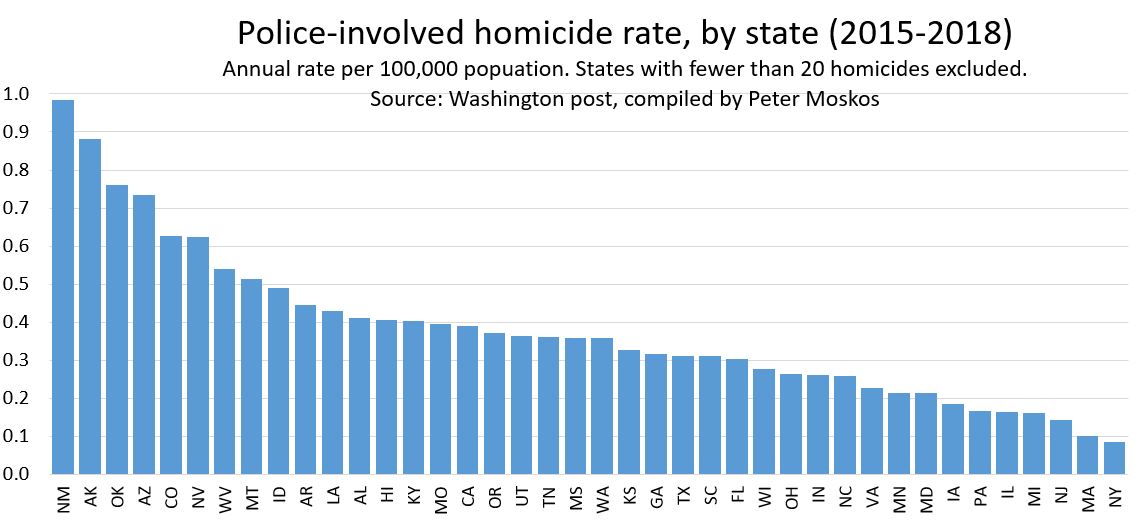
Take Oklahoma. Cops in Oklahoma are not getting killed a lot, per capita or per number (0.6 per year over the past 20 years). There’s not a lot of violent crime, and yet in the past 4 years cops in Oklahoma have killed 118 people. Again, I don’t want to get into what the correct ratio is, but seeing how the national average is 20 civilians-to-cops shot and killed, and seeing how some states are down under 10, why the hell is Oklahoma pushing 50?
Louisiana cops are getting shot at and killed three-times more often than cops in Oklahoma (and 8 times more often than cops in New Jersey). Both Oklahoma and Louisiana cops shoot a lot of people. But in Louisiana, dare I say, they have good reason to.
Comments
14 responses to “More on state differences in cops shooting people”
Interesting.
You didn't get into here, but I THINK you have in the past, is the idea that cops in more dense states/jurisdictions shoot less often simply because they're more used to mayhem and dealing with it.
Look at the cop in the recent NYC subway vagrant video. He would have been legally justified in drawing his weapon, but didn't.
Some rural cop somewhere who seldom or has never seen such mayhem gets confronted with such a situation and ZAP BANG POW.
I know "warning shots" are verboten, but if he had drawn his weapon and had an "accident" where he fired a round into the concrete I could "overlook" that.
Just a thought among many.
When Illinois State Troopers were pulled from downstate posts for temporary duty after ISP took over patrolling Chicago expressways many were shocked at what went on even on our highways.
Great stuff Hombre. I'm not convinced that the Pirate's hypothesis is the whole story, though I get his point. My guess is that cops out in those western states are, in some ways, more used to encountering people with guns, whether due to open carry or hunters and rifles in pickup trucks. So I'm not so sure they're quicker to ZAP BANG POW. If it's true that they encounter people with guns a LOT more often, then it could be true that they de-escalate (or just don't freak out) a LOT, but their small percentage of drawing down is against a larger number of opportunities. Just a guess.
I wonder if Pirate's hypothesis might really apply more to suburbs than to far west rural. I've always thought that suburban cops are close enough to the city to hear about a lot of violent crime and imagine it coming to them, but don't actually get much experience dealing with it, so maybe they can be a little more prone to over-react. Again, purely a guess.
Gary,
I don't believe my hypothesis is the whole story, but I suspect it's part of the story. Any complex social phenomena is going to have multiple and sometimes synergistic reasons behind it.
My guess is it's everything Peter mentioned, plus some other things.
Let's see if Peter's ideas get out there and let some really really tight assed social scientists spend years trying to quantify exactly which factors play a role and EXACTLY how much each factor accounts for.
It can't really be done with any legitimate specificity, but they will try and it will prove amusing reading.
Agree, but I'm an old guy. Don't have years to wait. Need my amusement now.
I want Cordner to publish an articled called "ZAP BANG POW." I would like to be cited.
I think all this focus on state differences (which granted, I started) actually obscures from what should be the real focus, which is substantial differences that happen at the city and county level.
Medium-sized cities out west with low black and possibly high hispanic populations seem to have the most shootings. Ever since hispanics had to also declare themselves white or black, hispanic data has been a mess. And impossible for anything police related.
Huge relative number of police shootings in Chicago's largely black and poorish south suburbs. Generally no worse from an economic standpoint than nearby black Chicago neighborhoods so what accounts for the differences?
Training, recruitment, pay, number of cops etc.
projects.bettergov.org/taking-cover/no-discipline.html
Yes.
Interesting, I saw an earlier version of that a year ago — bettergov.org/news/shaw-police-shootings-in-suburban-chicago-show-massive-failure-of-government
Pirate gets credit for ZAP BANG POW. Acknowledging that here in case I forget to do so when it goes viral under my byline.
Batman gets credit for ZAP BANG POW.
"Other things being equal, cops simply shoot more people if there isn't any push-back from (to over-generalize) blacks and liberals and media and anti-police protesters." Black Lives Matter matters. I would add that it's not just numbers, it's power.
I'm a bit skeptical about state density. The pop/sq.mi. figure makes it look like the population is evenly distributed over the square miles. So I would guess that Nevada has a low density. But if all those people are crowded into a couple of cities (Vegas, Reno), what you have is a state with a couple of counties with very high density, and many counties with very low density. Those are big differences that become invisible if you use the state as your unit of analysis.
To pick up on the density issue, I think some of the states that Hombre did not include, because they had so few officers killed, included the likes of Wyoming, Nebraska, the Dakotas, Vermont, New Hampshire, Vermont. Definitely rural, low density. Would probably need to include them somehow to get a truer picture of the relationship between density and officers shot/officer shootings.
To Jay's point, and I think Hombre mentioned this somewhere, an incident-level analysis would ultimately be helpful. Per Jay's example, if Nevada is rural and has high rates, but most of the shootings are in their two urban areas, then low density isn't the story. With state-level data we can't tell.
Still, I find the state level variations fascinating. It's not a small amount of variation, it's a lot.
Hello,
I am a criminal justice senior graduating in the spring with plans of going into law enforcement. I find it very interesting that you once worked in Baltimore as a police officer. I was born and raised in Maryland, I have hopes of moving back to the eastern shore and serving my hometown of Salsibury. Within your years of service, how did serving Baltimore rank within the other areas? Did you find the risks to be increased?
Unknown — Peter can speak to Baltimore, but something you might consider is Ocean City. Great place to start a police career and lots of "summer cops" have later gone on to Baltimore, all the county PDs, MSP, Salisbury, federal agencies, etc.
I am a senior at Purdue University Fort Wayne,and Police Officer of the FWPD. As a former Baltimore Police Officer how did your agency adapt to the new threats of police ambushes? Also how do you think Police can reduce the narrative that Police are out to shoot African Americans? I think the density issue makes sense and is interesting.