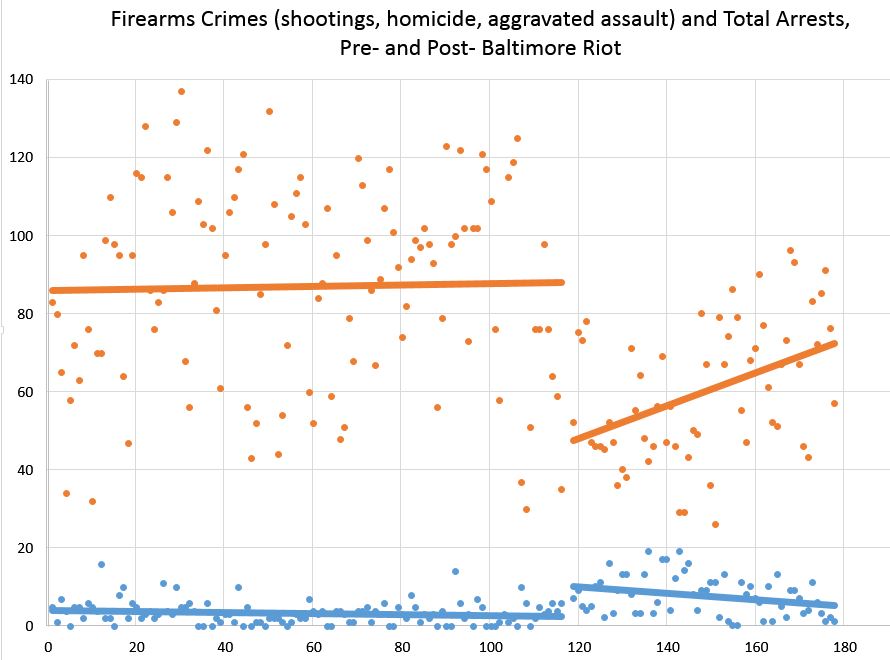
Total arrests per day are in orange. Firearms crimes per day are the lower lines, in blue.

(Click to embiggen)
The bottom axis represents the numbered day of year. 1 is Jan 1. 178 is June 27th. The riot was on April 27, day 117.
This was partly inspired by a frustrating discussion on the radio yesterday in which one person was trying to assert that Baltimore hasn’t seen any increase in violent crime related to the riot and its aftermath. What world is he living in?”It was up before the riots.” Yeah, a bit. “It’s seasonal. Shootings go up in warmer weather.” Not this much, they don’t! (And shootings were actually down in June compared to cooler May). But then the same guy also insisted there was no riot. (It was, of course, a “rebellion.”) Methinks his ideology may be trumping reason.
I like to think that facts matter, especially when lives are ending. So here we ago again….
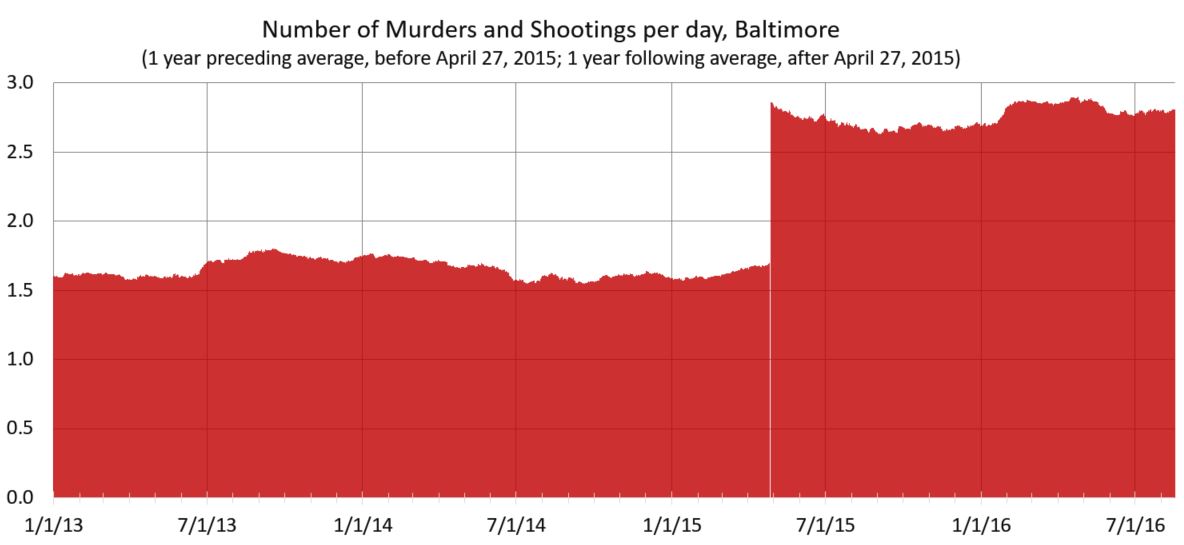
I’ve already looked at the massive increase in homicides (one more person each day is being killed in Baltimore post-April 27). This time I thought I’d look at gun crimes, which correlate very well with homicides, just to get a bigger N (more cases). And I excluded outlier arrests numbers from April 27 and 28 (which were 178 and 143, respectively).
These data go up to June 27, 2015. Before the riots, there were 3.4 recorded gun crimes per day (those classified as shootings, homicides, and aggravated assault with firearms) and 87 arrests. (Back in in the 2000s, there were roughly 275 arrests per day, which is worth noting.)
After the riots, there were 7.7 daily gun crimes and 60 arrests. That actually less of a decline in arrests than I suspected. But it’s still a one-third decrease. Gun crimes are up 118% post riot.
The good news, limited though it is, is the current trend. Arrests are inching up back up to “normal” and gun crimes are declining. While of course correlation doesn’t automatically mean causation, I beg anybody to offer an alternative hypothesis here. This social scientist is willing to assert cause and effect.
Here are the number this year compared to last year:
2014 pre-April 27: 3.4 gun crimes per day and 114 arrests.
2014 post-April 27: 4.9 gun crimes per day and 117 arrests.
2015 pre-April 27: 3.4 gun crimes/day (identical to 2014), 87 arrests.
2015 post-April 27: 7.7 gun crimes per day and 60 arrests.
So we might have expected a 40 percent increase in gun crimes after April 27 as a seasonal factor. We saw a 126 percent increase.
(It’s worth pointing out that I’m not saying arrests are good just for their own sake, but they can be a good indicator — a proxy — for more general discretionary crime-preventative proactive policing.)
[see future post: The Freddie Gray Effect in Baltimore]
Source: Baltimore Open Crime data.
Comments
One response to “Post-Riot Baltimore: Arrests Down and Gun Crimes Up”
The scale on the blue/crimes on the bottom of your chart makes it less persuasive than the data would indicate. It takes a lot of arrests to eliminate a serious gun crime.
On another note, what if the trends continue and the data moves to the pre riot level? I mean, fairly stable and about the same magnitude?
It would be even more depressing if these long term trends are immutable. If a single incident can more crime up, maybe something can move it down. If an incident can only provide a temporary blip …