
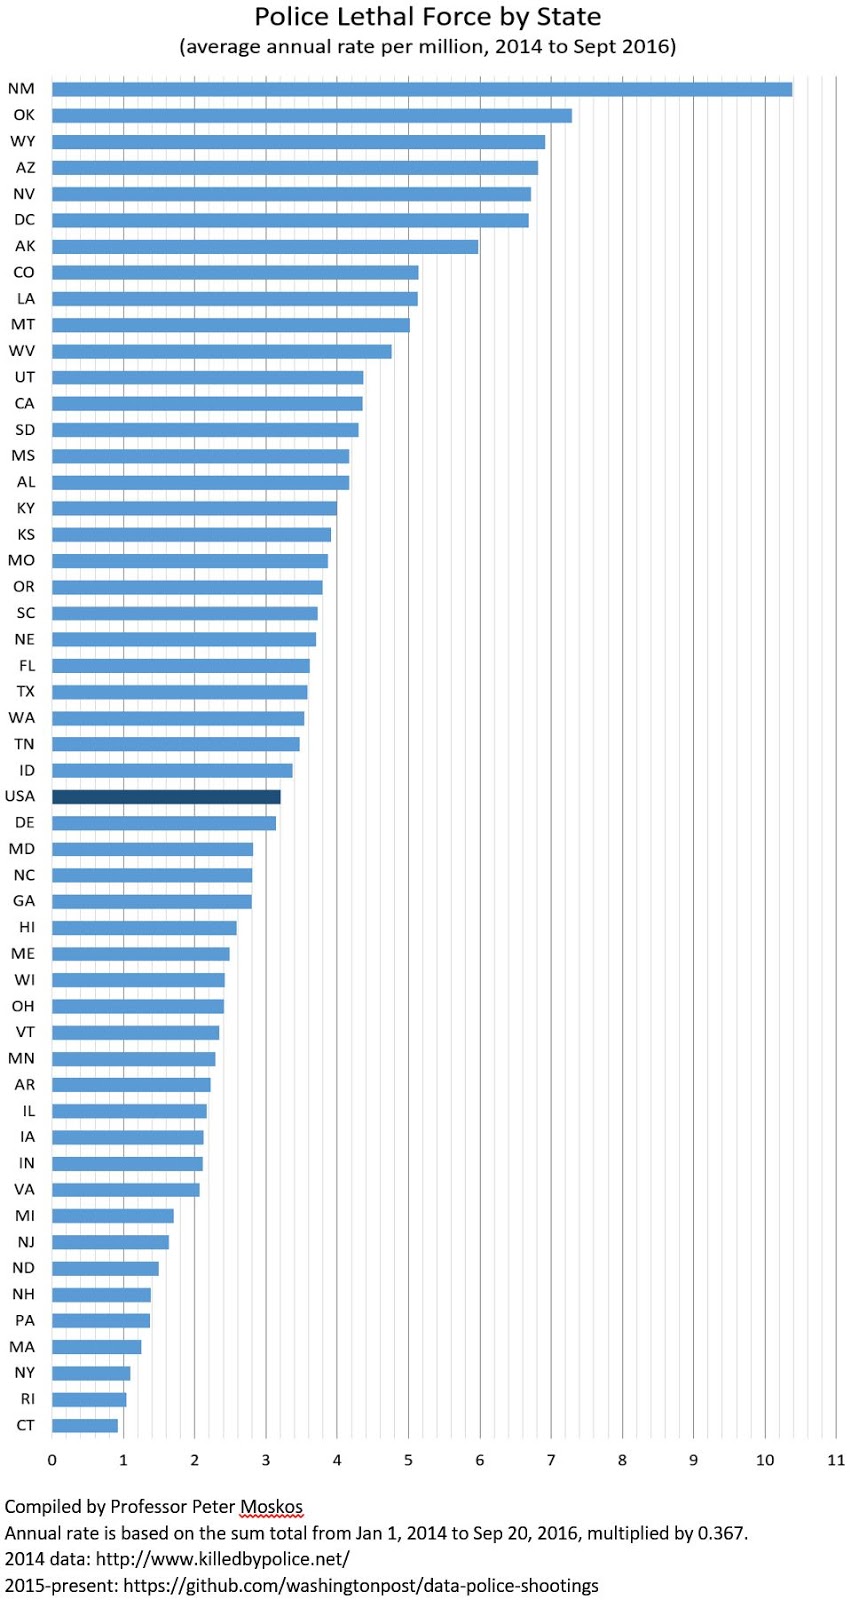
If we want to reduce police-involved shootings— and we do — why not focus on states where cops shoot the most and learn from states where cops shoot the least? These differences are huge. What is New Mexico doing wrong? What is New York doing right? The top twenty states (ignoring D.C.) are all west of the Mississippi. Arkansas is also noteworthy. I would expect it to be toward the top, but its rate of 2.2 is below the national average.
Take this chart with a grain of salt.
[See 2020 caveat.]
The data are uncorrected and I can’t promise it’s error free. And the absolute number (n) for many states is low (18 have n < 20, for instance), so the data for a lot of these states are statistically dodgy. But the greater regional trends are pretty pronounced.
Here are the raw numbers, sorted small to large: RhodeIsland 3, NorthDakota 3, Vermont 4, NewHampshire 5, Delaware 8, Connecticut 9, Maine 9, Hawaii 10, SouthDakota 10, Wyoming 11, Alaska 12, DistrictofColumbia 12, Montana 14, Idaho 15, Iowa 18, Arkansas 18, Nebraska 19, Massachusetts 23, WestVirginia 24, Kansas 31, Minnesota 34, Mississippi 34, Utah 35, Indiana 38, Wisconsin 38, NewJersey 40, Oregon 41, Michigan 46, Maryland 46, Virginia 47, Pennsylvania 48, Kentucky 48, SouthCarolina 49, Nevada 52, Alabama 55, NewYork 59, NewMexico 59, Tennessee 62, Missouri 64, Louisiana 65, Washington 68, Colorado 75, Illinois 76, Ohio 76, NorthCarolina 76, Georgia 77, Oklahoma 77, Arizona 125, Florida 196, Texas 263, California 460, USA 2787
Comments
7 responses to “State Variance in Police Use of Lethal Force”
We want PIHNs!
Aw, that's so sweet you remember! But I need to get ready for class. (Feel free to do it for me.) And I think PIHN would work only on the more local level of city or neighborhood. I don't think it would be so good for state-level analysis. Too much intra-state variance in key variables.
The PIHN posts:
copinthehood.com/2014/10/whats-up-in-riverside.html
&
copinthehood.com/2014/10/the-pihn-winners.html
Though there are definitely some outliers, the trend does seem to follow fairly well with population density:
en.wikipedia.org/wiki/List_of_U.S._states_by_population_density
Far more outliers if you look at the state by state violent crime rate:
worldatlas.com/articles/the-most-dangerous-states-in-the-u-s.html
Violence is so local, I don't think much could be garnered from state-level data. And even something like density would need to be pared down to figure out where the shootings happen. I doubt the vast empty spaces of, say Oklahoma, affect policing in Oklahoma City. Or Abq (which has a lot of shootings) and greater New Mexico I suspect density does matter. But I also suspect state-level density it too broad, but correlates with something significant.
Agreed state-level PIHNs would be problematic…but state level per-capitas of course raise some similar issues.
Anyhow here is a lazy version using the CDC's 2014 homicide data as proxy for homicide throughout your 3ish-year period (which I think means I need to multiply your "raw" homicide numbers by 0.367 to get a proper PIHN??)
PA 2.8
MI 2.9
AR 3.0
NY 3.3
CT 3.3
IL 3.5
MS 3.8
IN 3.8
NJ 3.9
RI 4.1
GA 4.3
MD 4.4
LA 4.4
OH 4.8
SC 5.0
NC 5.1
VA 5.1
DE 5.2
MO 5.3
AL 5.4
TN 6.0
FL 6.2
TX 6.9
ND 7.3
MA 7.7
WI 8.4
IA 8.5
WV 8.6
KY 8.7
VT 9.2
CA 9.3
NH 10.8
NV 10.8
KS 10.9
NE 11.1
OK 11.3
WA 11.8
AK 11.9
HI 12.2
MN 12.4
SD 14.1
AZ 14.2
ME 14.4
OR 15.2
ID 15.3
CO 15.6
NM 16.0
WY 16.8
MT 17.1
UT 21.1
I've been working on this kind of thing but at the county and even intra-county level. It is hard to do anything too local because fortunately (unfortunately for statistics) there just aren't enough shootings to get real statistics.
What I have found so far is that St. Louis, Oklahoma city and Baltimore have the highest shooting rates; however in most of these cases the higher shooting rates correlate with more crime. In fact I have run a few random forest classifiers just giving it the crime rates (broken down by race) for violent crimes and property crimes plus a few other things like GINI index and percent in poverty and the classifier can identify the race of the person shot to about 95% accuracy. Maybe this isn't surprising but it was surprising to me.
Keep me updated.