Tag: race

  • Murdered in the Park

    Murdered in the Park

    Just last month, I swear I told my class, “People won’t talk about crime until a cute white girl gets murdered.” Tessa Majors, unfortunately, is that woman. Would her murder be getting as much press if she had been black? I doubt it. But who knows? Turns out not a lot college students of any race get robbed and killed. But that’s not what I’m going to write about.

    Nor am I going to write about that the murder weapon seems to have been a 4-inch folding knife. Why do I point this out? Because this is the exact kind of knife that was made legal just last year, against the advice of law enforcement, and heralded by some as a “heroic” and “a massive victory for justice in New York.” Bravo.

    Nor will I go into what Majors might have been doing in the park. Nor the shameful conduct of the SBA (union) President, Ed Mullins, in publicly releasing details of an in-progress investigation to make political hay.

    Nor will I touch on the fact that the apparent robbers and murders are but kids, aged 13 and 14. “What can you do?” cops say, “Our hands our tied. They’re kids and weed isn’t enforceable anymore.” That’s bullshit, of course. They seem to have been causing trouble for quite a while. Cops could at least ask, “What are doing and where the hell is your guardian?” and take it from there. That’s where the attention and proactive help needs to be focused. The problem is coming from inside the house. I guarantee it. But if nobody else dares go there, why should I?

    Cops, at least in theory, might have prevented this murder with proactive policing. But in doing so they might have become a media sensation. And not in a good way. If you were a police officer and you suspected these kids of previous crimes, would you risk
    stopping them on reasonable suspicion? In a park? God forbid the kid is uncooperative and runs. Or puts up a fight. With indignant Columbia students pulling out their phones and calling you racist?

    For police, at least in terms of public relations — and this is a current and real problem — it’s probably better to have a poor woman murdered that risk the public indignant public and political pushback from stopping a 13-year-old black kid on suspicion of criminal activity.

    I’m not going to talk about any of that. Here’s where I do want to go: the numbers. I like data. And when I looked at them in New York City, I see these kinds of robbery/murders are rare. Really rare. Particularly for women. And then for white women? It basically doesn’t happen. But it did. and I guess that’s the definition of news.

    I took the UCR murder numbers [FBI Uniform Crime Reports] for New York City. I excluded “unknowns” for all the variables I’m looking at. That is not a moderate cut, particularly with regards to “offender 1 circumstance” and “victim 1 relation to offender 1.” How much it matters? I don’t know. But it does matter. But perhaps not so much to my main point, which is that this type of crime really is rare.

    In the past 20 years — since 2000 — only 2(!) women under 20 have been murdered by strangers in a robbery. It’s the not young who are at risk, but the old. Most women victims are over 50. Five of the 20 women victims were over 80 years old, which seems particularly bad. The last time a white woman of any age was killed by a stranger in robbery was 2015. Before that was 2011 and 2009. All three of the victims were senior citizens. The robber/killers were all in the 30s. One was white, one was black, one was hispanic.

    Since 2012, there have been but 30 people murdered by strangers in robberies in New York City. Total. Last year just one person in New York was murdered in a robbery by a stranger. One. A 66-year-old Asian man. In 2017? Four. All men. Same in 2016. There haven’t been more than 10 such murders a year in nearly a decade and not more than 20 such murders in a year since 2002. But in 1988, there there were 124 such victims! It really was a different city.

    Since 1992 — arguably when New York City started becoming safe — there have been 28 murders of women (and 287 of men) by strangers in robberies. Yes. Total. Since 1992. In 8 different years since 1990, the number of women killed in robbery has been zero.

    As to race, it seems that Asians are disproportionately targeted and victimized. But with that notable exception, victims or robbery/murders seem to reflect the demographics of New York City, at least generally. Offenders are disproportionately (but not exclusively) black men. For the women victims since 1992, 17 were white, 8 black, 2 Asian (1 unknown). Of their robber/killers, 17 were black, 10 white (1 unknown). Two women were murdered by women.

    Note the scale of the y-axis is much more magnified on the second picture.

    My point is that this type of crime — a woman being killed by stranger in a robbery — is rare in New York City. No, not just for white women. And not just for women. So when something like this does happen, it should be news. No, not cause for alarm and the ever-feared (at least in criminal justice circles) “over reaction.” But no, this shouldn’t be swept under the rug. Because we don’t want to go back to the days when the public lived in fear and people were literally being murdered by strangers in robberies gone wrong on a near daily basis.

    Rest in peace, Tessa Majors.

  • Murder down for whites but not blacks

    The 2018 murder rate is down from the previous two years, but higher than we’ve seen in 6 of the past 10 years. Last year’s murder rate is the same as 2015. And 2009! And yet I keep hearing every year that violence is down. So what’s this trend? And sort of related, why do some people insist on the “violence is down” message year after year, even when it’s not true?

    Yes, violence is lower than it was in 1991. Violence will hopefully always be lower than 1991. But that doesn’t mean violence is trending down year after year. If we keep starting the graph around 1991, violence will always look downward trending.

    The murder rate in the US actually peaked in 1980 at 10.2 (per 100K). And then there was the lesser but better-known crack-trade-related murder peak of 1991 (9.8 per 100K). So we’re down from there, no doubt.

    Violence plummeted in America between 1994 and 1999. It might be worth pointing out that is right after the Biden-supported and now maligned crime bill. I don’t actually think that’s why crime went down, but it does correlate. And it didn’t hurt. It might have helped.

    Whatever the causes — and I do think better policing (along with changes in drug dealing) was a huge part of the solution — many lives were saved between 1994 and 1999. Of course, as always, there were racial disparities. Blacks benefited most from the decline in violence. From 1994 to 1999 the number of black murder victims dropped from about 12,000 to 7,000 per year! White murder victims declined, too (but less so, from 11,000 to 8,000). This brings us to 1999.

    Since 1999, the murder rate for whites has dropped even more, another 20%. Great news! But not for blacks. In absolute numbers, more blacks were murdered in 2018 than in 17 of the past 20 years. That’s not a good trend.For African Americans, murder has been up and down over the past 20 years. But the murder rate is no better in 2018 than it was in 1999.

    Image


    What bother me is some of my friends who insist “violence is down” are well intentioned white people who live in safe neighborhoods, hashtag#BLM, and believe those who advocate less policing in other people’s neighborhoods. (Neighborhoods they won’t set foot in, mind you.)


    Yes, violence is down compared to 1991. But is it a sustained “trend”? Not really. Not if you start the clock in 2000. And not for non-whites. Not for young black men in particular. So when people say violent crime is down, ask “For whom?”


  • More on state differences in cops shooting people

    Inspired by some twitter threads — mostly this onewith Gary Cordner and this onewith Andrew Wheeler — I thought I’d look more at the cops getting killed as a factor in cops killing people.

    I like presenting this stage of research. In part because coming up with ideas and hypotheses and basic number crunching is what I like doing most. (I’ll leave the journal article submitted and advanced stats to others.) I’ll explain my steps partly to help others, but also to help me go through this on the old assumption that if you can’t explain it to others clearly, you don’t really understand it yourself. (I used Excel and PSPP.)

    I’m always partial to fewer better-data over more bad-data. So, as I often do, I’d like to stick with good old murder: officers shot and killed on duty (from the officer down memorial page, which over the years I’ve found close to faultless, which is more than one can say for the UCR or anything else.)

    The problem (from a statistical not a moral sense) is that there are many states in which very few officers are killed. So I went back to gather 20 years of data (for no particular reason, just a choice, it could have been 10 or 30) and got the number of officers killed between 1999 and 2018, by gunfire, for each state. 50 states. 990 total deaths. I dropped the states where n < 10. That leaves 33 states. Texas and California top the list, which isn’t surprising because they’re big states. But then come Georgia, Florida, and Louisiana. Interesting…

    But what’s the best denominator? I mean obviously one needs to look at population to get a rate. But which population? In order, I’m going to consider 1) number of cops, 2) population levels, and 3) violent crime levels, 4) population density, and 5) percent of population that is African American.

    1) Perhaps we should look at cops killed in terms of how many cops there are in any given state, so as to consider the chance of any given cop being killed on duty. Makes sense to me, the problem is that the official data even on how many cops there are looks dodgy. It seems unlikely to me, for instance, that Mississippi went from 5,222 cops in 2007 to 2,524 in 2014 (the two years anybody attempted to count, but reporting is voluntary). If I don’t trust the data, I don’t want to use it. But I still did the numbers, based on the average between 2007 sworn officers and 2014 sworn officers.

    For presentation purposes, let’s use the USA average (using all 50 states) as a baseline, set that to 0, and compare all the states:

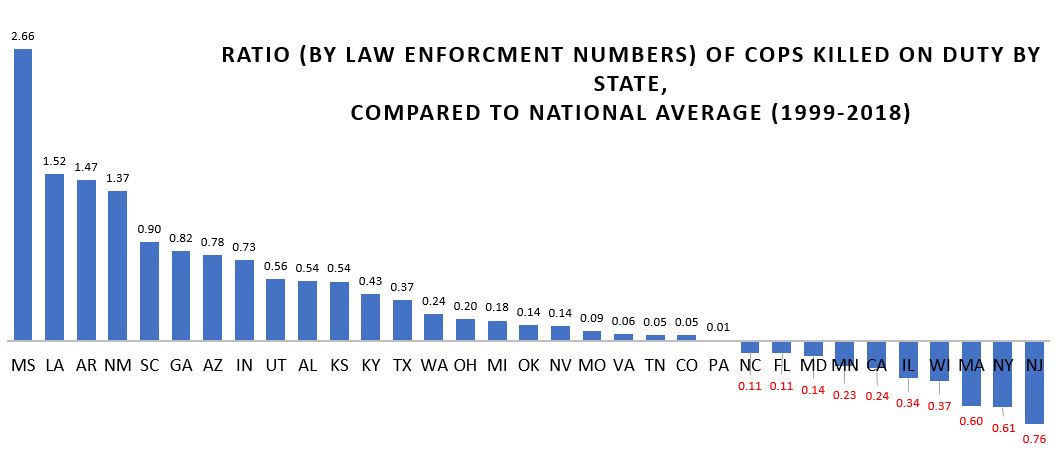
    Cops are more likely to be killed in MS, LA, AR NM, SC, GA, and AZ. Keep in mind the small and safe states have been removed from the calculation. I don’t like this. If nothing else because I don’t trust the Mississippi numbers.

    2) So let’s just use overall population as the denominator. I’m using 2016 population because that’s what I already have in my file. Some states have grown a lot in the past 20 years. Oh, well. I don’t think it matters that much for these purposes. If it does, we can consider it later. Keep in mind these are ratios, the actual numbers by themselves are meaningless. But as a ratio, yes, a value of 1 means a cop is twice as likely to be killed per capita. It does appear that a cop in Louisiana is about 4 times as likely to be shot and killed as a cop in New Jersey.

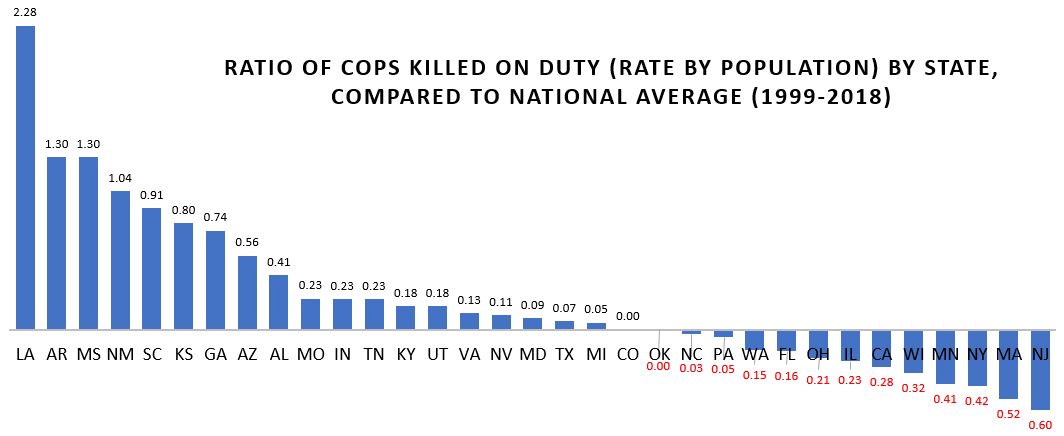
    This says that Louisiana, by far, is the most dangerous state to police in. Arizona is next. And given that its population has grown drastically in the past 20 years, it should really be higher. And that would make LA seem like less of an outlier.

    New Jersey, Massachusetts, and New York are all comparably safe. I won’t say the safest because the 17 safest (and smallest) states have all been dropped for the statistical reason of having fewer than 10 cops murdered over the past 20 years.

    I think number 2 (population) is better than number 1 (number of cops). But they’re not drastically different. You get the same states on top and the same states on bottom. But I’m going with state population as the denominator because I don’t trust the count of cops.

    3) Now let’s consider violent crime as an independent variable (which is the variable that affects something else, on which something else is dependent). And back to using all 50 states.

    I just got some crude numbers off wikipedia and then took an average of 5 years of data for each state. (Not the best methods, but probably accurate. Certainly fine for preliminary work.)

    Let’s run some correlations. I like correlations because they’re easy to understand. They also tell you where you should look for deeper answers.

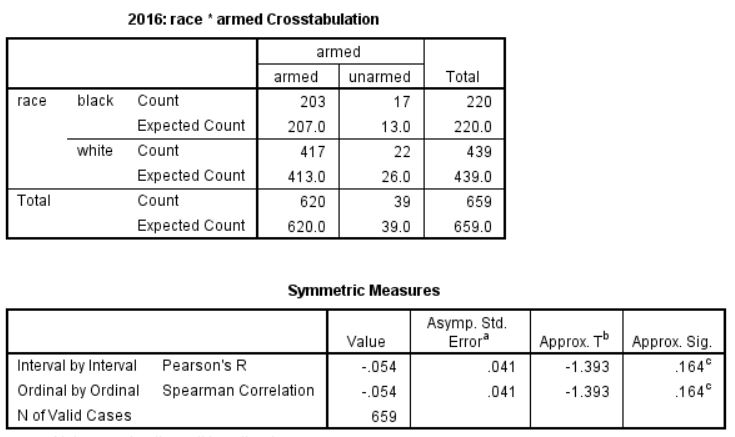
    First question: at the state level, is violent crime rate correlated with cops getting killed? Absolutely (Pearson Correlation = .62, Sig = .000). This is a strong and unsurprising relationship.

    Next, at the state level, is violent crime correlated with being killed by cops? Surprisingly, technically, statistically, no. (correlation = .23 sig = .104) Not at the state level; not with an N of 50. Now I know from other research that violent crime is correlated with being killed by cops, but you’ve have to delve down into the neighborhood level to see that effect. But still, if it that doesn’t come out at the state level, it’s a clue that something else is also at work! This is where things get interesting. Something else is also at play on a state level that is more significant than straight-up levels of violent crime.

    4) What about geographic area? This is where wikipedia is great because you can get state size in seconds. And then if you already have population and you’re handy with cut-and-paste and sorting on spreadsheets, you can get population density in minutes.

    And it turns out the population density is indeed correlated with a lot.

    Lack of density — more space — is correlated with being more likely to be killed by cops. Think of what this means. Common sense tells you it’s not a view of “big sky country” that makes cops shoot someone. Whatever really matters, is correlated to density (or lack thereof). Maybe it’s single person patrol. Or the time for backup to arrive. Or meth labs. Or gun culture. This is why they say “correlation doesn’t equal causation” (which is also the most frustrating phrases in social science, because correlation can very much indicate causality, and the phrase is often used to dismiss meaningful correlations as meaningless.)

    Population density (lack thereof) is also correlated with cops being killed. Density is not at all correlated with crime (like not even leaning in one direction). And yet both crime and density are heavily correlated with a lot of other factors. And both are correlated with cops being killed. More crime = more cops killed; more density = fewer cops being killed.

    So now lets do a brief multivariate analysis, which is about as far as I go. This means that we look at more than variable at the same time. Which is more important (plays a greater role) in cops being shot and cops shooting people? Crime or density? (Or something else.)

    Density seems to be more predictive than crime in terms of cops killing people and less important in terms of cops being killed (though for the latter both are correlated).

    When I move “cops killed” to the independent variable side and keep a focus on people killed by cops, density becomes less important and violent crime becomes more important. This makes intuitive sense. Because the issue with a spread out area is that cop, alone, would face greater threats.

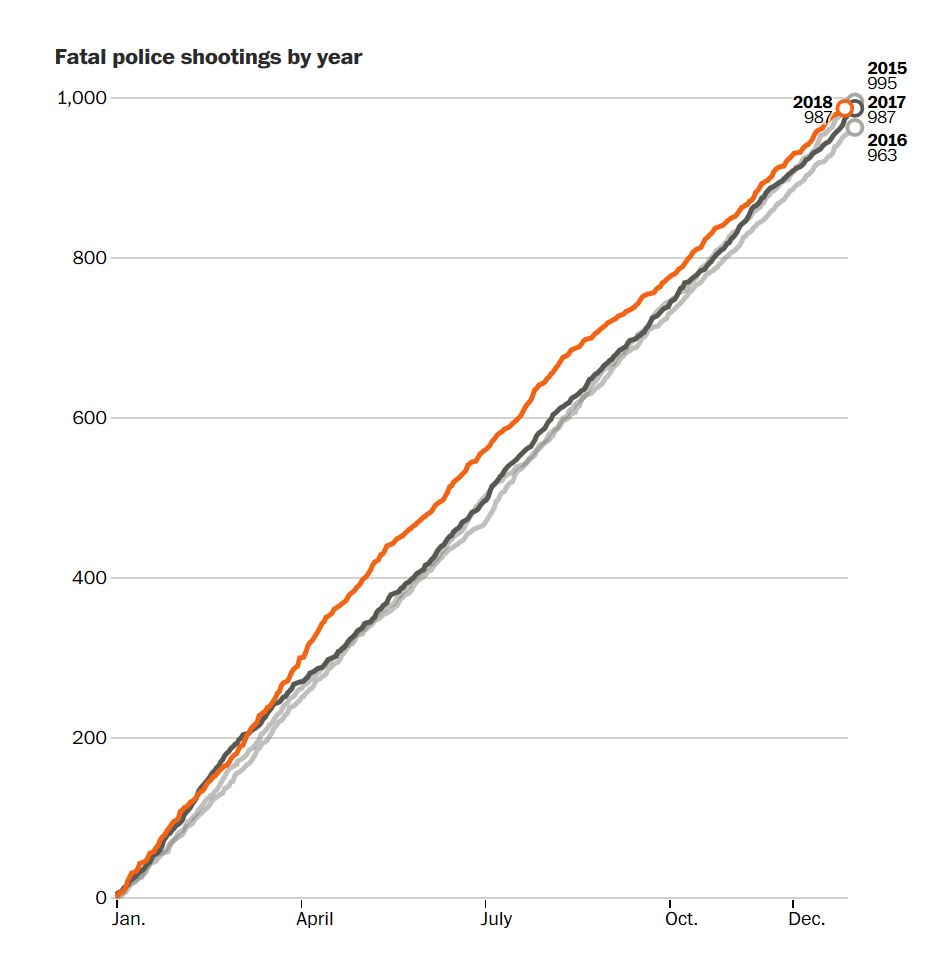
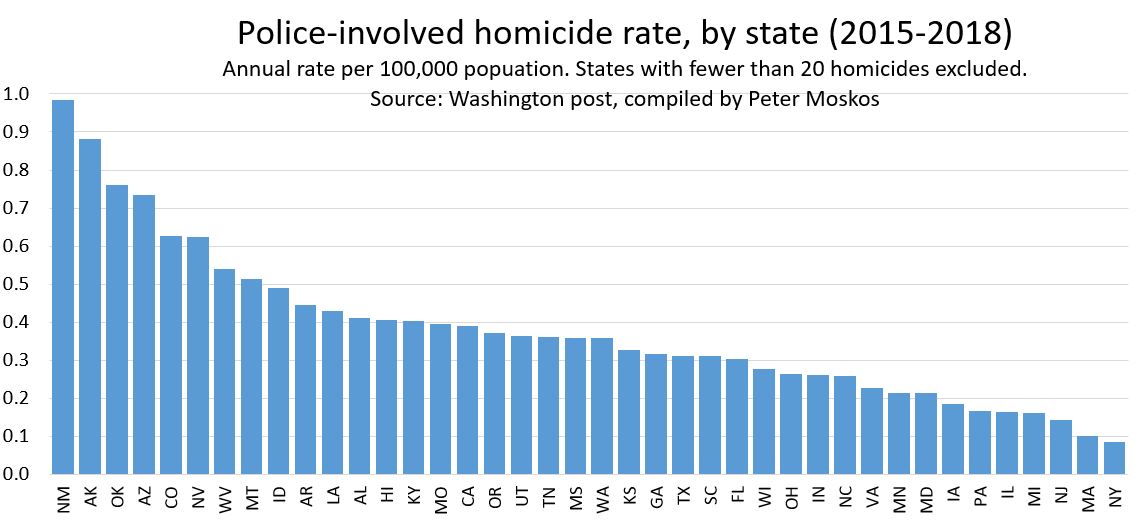
    Keep in mind the above is about cops being killed. Much more talked about (by non cops) is people killed by cops. I wrote about that a few days ago.

    If you’re still with me, kudos. Causes here’s where the whammo happens!

    Were one to only look at individual variables, the key would seem to be density followed by crime and rate at which cops are killed. But it turns out that much of what is measured in those variables are simply correlated with and less important than the percentage of black population in a state. Crime matters. Police being killed matters (independently of violent crime), population density may matter a little, and of course other variables that I’m not even looking probably matter a lot. The question is always if they can be identified and accurately quantified.

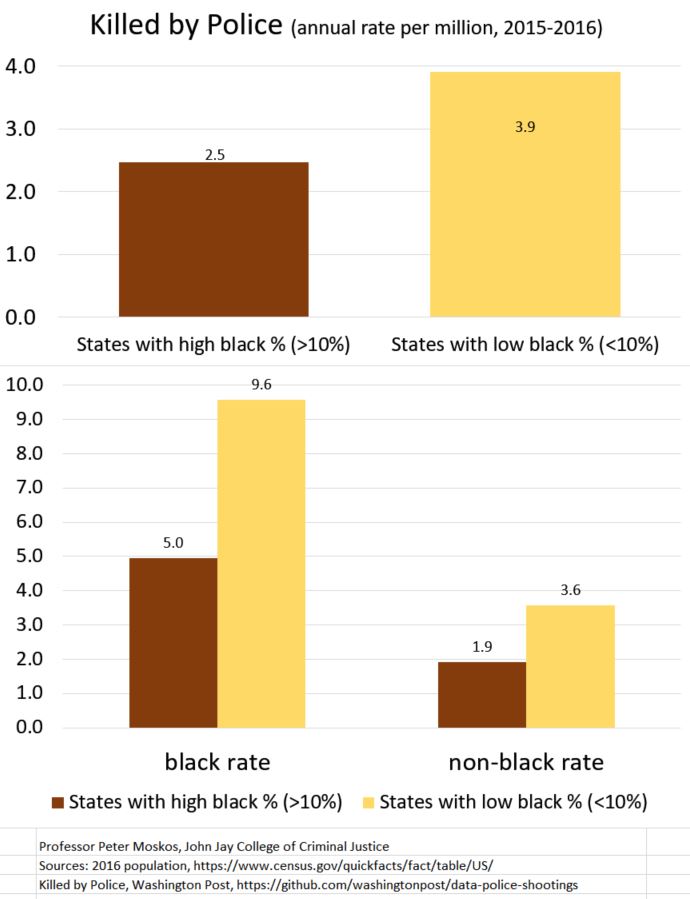
    Last year I observed that cops shoot more often in states that have fewer blacks. So I already had a strong hunch to look in this direction.

    When one puts the state’s percentage of African-American residents into the equation, things start to fall into place. This is also taking into account how often cops get shot, crime, and density (which finally starts to lessen in importance — because as we know is only indicative of other factors — but still probably important in terms of gun laws and culture and police-backup).

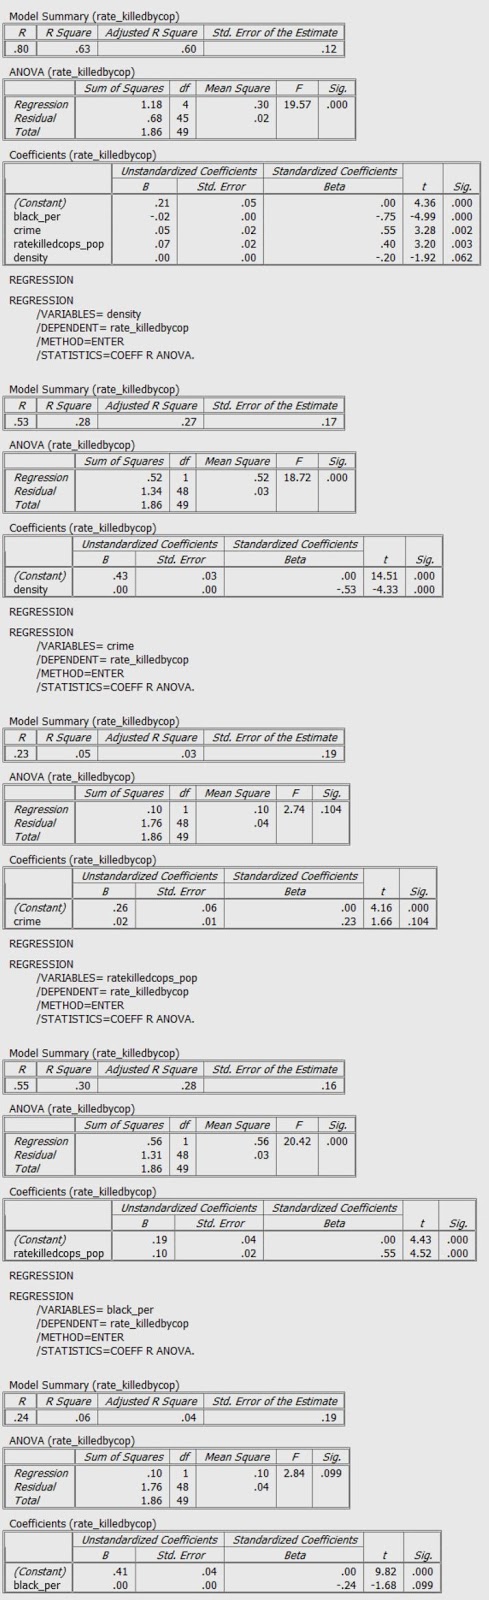
    If one considers crime, density, and black percentage — but only when one does so all together — all three are significant (with an R-squared of .55). When one adds the rate at which cops are killed, r-squared goes up to .62.

    [R-squared is technically the distance (squared to take account of negative numbers) that data points are from the trend line of a chart. At some level, r-squared is supposed to indicate how much of what is being looked at is explained by the independent variables in the statistical regression. But that’s more in a statistical sense than a real-world sense. Still, generally, other things being equal, a high r-squared is better than a low r-squared. And an r-squared of 0.63 ain’t shabby for this kind of game.]

    So what does all this mean? Density matters, but not so much for what it is but for things correlated with it (same could be said for race). All these variables have “intervening variables,” the way people act, the choices they make, the factors that make us do what we do. Things that may be harder to measure than crude indicators like “population density” and “race.”

    Still, looking a these variables, density seems mostly to correlate with the lack of African-American in a state. The black percentage of a state seems to be the most significant factor in determining how many people are shot and killed by police (with overall violence and cops being killed also being important). But, contrary to what many people believe — and basically all of the “narrative” of the past few years — the relationship is inverse. The greater the percentage of blacks in a state, the less likely cops are to shoot and kill people.

    This is counter-intuitive to a lot of people, particularly if you think cops only shoot black people. But it makes perfect sense if one thinks about it in two parts:

    1) Whites don’t really care about who police shoot; period; end of story. And without the pressure over bad (or even good) police-involved shootings, cops never learn how to shoot less. Other things being equal, cops simply shoot more people if there isn’t any push-back from (to over-generalize) blacks and liberals and media and anti-police protesters. Call it the Al Sharpton Effect, if you will. Basically, in many places, police organization and culture do need to be pressured into changing for the better.

    2) Police can be recruited, trained, and taught to less often use legally justifiable but not-needed lethal force less. The state variations in police use of lethal force are huge. Some states (and particularly jurisdictions within states) do it better than others. Instead of saying “police are the problem” we could look at the states and cities and department that are doing it better and learn.

    Ultimately what we need are well and better trained police officers who shoot less often, but still shoot when needed.

    I’ll leave you one final bit of data. I don’t know if there’s a there here or not. My guess is this does matter. But maybe it’s just a clue that leads to the above. Or maybe it’s something else. Maybe you can figure it out.

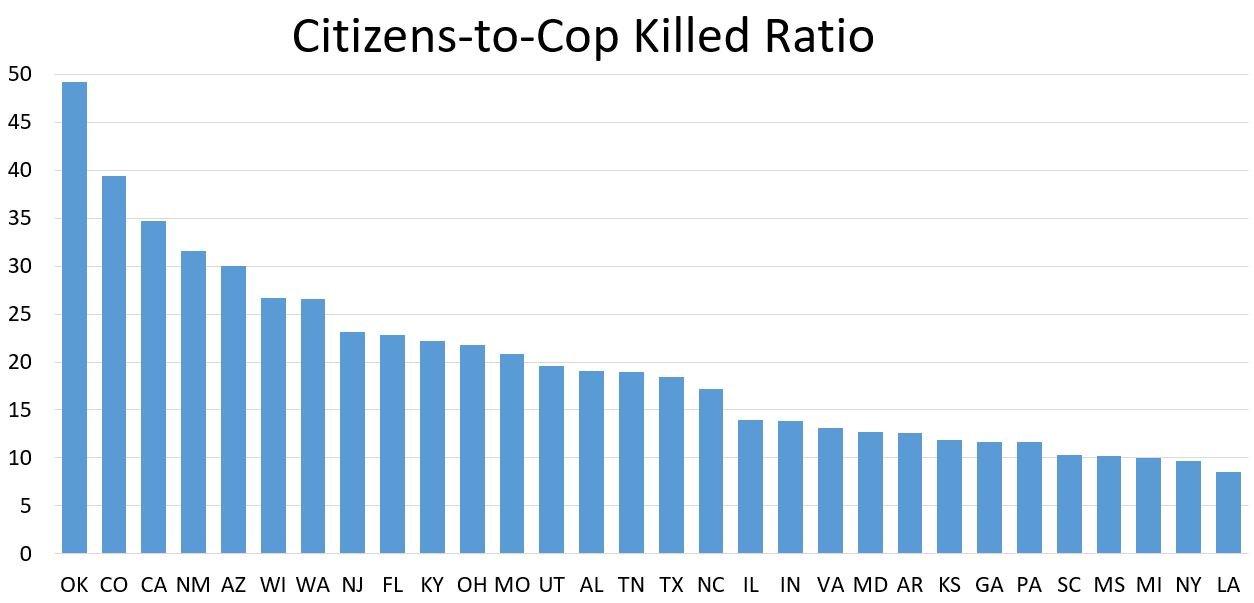
    This is a table that shows a simple ratio: the number of citizens killed for each cop killed. Good people can debate what this ratio should be. I don’t want to go there. The correct ratio is no cops getting killed and few criminals getting killed. But what’s interesting to me is the that there is such a large difference between the states, and by a factor of 10! By and large the states on the high-end (more citizens getting killed) are very white and the states on the low-end (fewer citizens getting killed) are disproportionately black.

    Take Oklahoma. Cops in Oklahoma are not getting killed a lot, per capita or per number (0.6 per year over the past 20 years). There’s not a lot of violent crime, and yet in the past 4 years cops in Oklahoma have killed 118 people. Again, I don’t want to get into what the correct ratio is, but seeing how the national average is 20 civilians-to-cops shot and killed, and seeing how some states are down under 10, why the hell is Oklahoma pushing 50?

    Louisiana cops are getting shot at and killed three-times more often than cops in Oklahoma (and 8 times more often than cops in New Jersey). Both Oklahoma and Louisiana cops shoot a lot of people. But in Louisiana, dare I say, they have good reason to.

  • State variation in police-involved shootings

    State variation in police-involved shootings

    Welcome to 2019!

    I’ve compiled the past four years of Washington Post data on those shot and killed by police. Four years gives us a reasonable amount of data. The first thing that jumps out is that the number of people killed by police has remained strikingly constant each and every year for which we have data (from the Washington Post).

    The other thing that continues to jump out (I’ve written about this before) is the state-by-state variation.

    The national annual average (2015-2018) is 0.31 (rate per 100,000). And yet New Mexico is 0.98 and New York is 0.09. This is a large difference.

    Or take Utah (because of this story in the paper). Utah has a murder and violence rate below the national average, a low poverty rate, and is 90 percent white. And yet people in Utah are almost 5 times as likely an in New York to be killed by a cop. Utah has murder rate lower than NYC, 1/5 the poverty rate, far fewer cops, and Utah is 90% white. In 2018, the rate of people shot and killed by police in Utah is multiple times higher than NYC.

    In all states (except small states in which n = 0) blacks are more likely than whites to be shot and killed. But states that have less police-involved shootings overall have greater racial disparity. But a  black man in Virginia or New York or Pennsylvania is still far less
    likely to be shot and killed by police than a even white man in Utah,
    Oklahoma, or Wyoming.

    I’d speculate significant variables are (in no particular order) training, fewer cops per capita, fewer cops per mile (no backup), one-person patrol, more guns, gun culture, more meth, more booze, and race (with more white states having more police-involved shootings).

    The ten leading states — as in cops-most-shootingest states — in rank order, are New Mexico, Alaska, Oklahoma, Arizona, Colorado, Nevada, Wyoming, West Virginia, Montana, and Idaho. It certainly seems like if we were to focus on the states that have the highest rates of police-involved shootings (and by far), we could find some low-hanging fruit to reduce the number of said shootings. But to do this we’d have stop thinking of police-involved shootings as primarily related to race.

    Collectively the top-10 (where cops kill most) states are 4.9 percent African American (compared to 13 percent nationally). These are the cowboy states out west. The 10 states with the highest percentage of black population (collectively 25%) have a rate of police-involved homicide (0.24) that is below the national average.

    All this said, the really large differences are found at the local level. Albuquerque, Bakersfield, Tulsa, and Salt Lake City all have rates above 10 per 100,000. New York City’s is less than 1.0. But that’s for another time.

    Update: later post from July 2020 http://www.copinthehood.com/2020/07/05/variations-in-police-involved-shootings-by-city-and-county/

    Update: 2020 caveat.

  • Police use less lethal force in states with more blacks

    Police use less lethal force in states with more blacks

    Recently I came across a breathless headline in Salon: “Number of fatal shootings by police is expected to reach 1,000 for third year.” That’s an odd way to put it because A) it implies the number has been at a record high the past three years when B) this is only the third of three years the Washington Post has been counting and C) it’s not true.

    According to the Washington Post data they cite, there were 991 people shot and killed by police in 2015 and 963 in 2016. The more accurate headline, as see in the actual Washington Post is: “Number of fatal shootings by police is nearly identical to last year.” Well, that’s a bummer if one is trying to hype a crisis. Also “reach” is not synonymous with “approach.” But I’m not hear to quibble about the semantics of a few dozen deaths.

    The number of those killed by police seems to be steady at just under 1,000 per year. But given the increase in homicide, it’s actually surprising the number killed by police hasn’t increased. When violence goes down, as it did in the 1990s, police shoot fewer people. When violence goes up, as it did in the late 1980s, police shoot more people. I suspect there are two variables pulling in opposite directions. One involves more violence in general — increasing police-involved shootings — and the other involves less police engagement and fewer interactions with citizens. Less proactive policing means fewer interactions and less that can go wrong (and also more crime).

    I looked at the Washington Post dataof those shot and killed by police in 2015 and 2016 and broke it down by states with more and fewer African-Americans. States that are more than 10 percent African American include 21 states plus D.C. (198 million people, 18 percent black, 36 million blacks). There are 29 states less than 10 percent African American (126 million people, 6 percent black, 7 million blacks).

    People, all people, are 1.6 times more likely, per capita, to be shot and killed by police in states that are less than 10 percent black compared to states more than 10 percent African American. Blacks are still more likely than whites, per capita to be shot overall. But this ratio (2.6:1) doesn’t change significantly based on how black a state is.

    For both whites and blacks, the likelihood of being shot by police is greater in states with fewer blacks. And the difference is rather large. There are seven states less than two percent black. In 2015 and 2016, zero blacks were shot and killed in Maine, New Hampshire, Utah, Vermont, Wyoming, Idaho, and Montana. But if you think cops don’t shoot people in these states, you’re wrong. Compared to the four states with the highest percentage of African-American (Mississippi, Louisiana, Georgia, and Maryland are more than 30 percent black), the overall rate of police-involved killings in states with few blacks is higher. And this is despite a lower rate of overall violence.

    The implications of this are many, but for starters, if one wishes to reduce the number of people shot by police, it would make sense to focus on states that have more police-involved shootings in general. New Mexico, Alaska, Oklahoma, Wyoming, and Arizona have rates two and even three times the national average. Even though California ranks only 13 out of 51 (4.2 per million compared to 3.0 nationally), California is significant because it’s so large. In terms of reducing police-involved shootings, these are the low-hanging fruits.

    Were the states with fewer blacks able to reduce their rate of lethal force to the level of states with more blacks, there would be an 18 percent nationwide reduction in the number of those killed by police. But this would require a move away from a general focus on policing and race toward a focus on police departments that shoot a lot of people of all races (particularly hispanics, it should be noted, and not examined here). Alas, at the intersection of police, race, and ideology, I’m not holding my breath.

    And there’s a caveat: though state-level data is revealing, it’s often too general in terms of policy solutions. Intra-state differences are very large (and not examined here). Policing is local, and some local jurisdictions simply shoot a lot more peoplethan others. (That linked-to post is from two years old, but the basic points are solid).

    Here are the raw numbers. As always, click to “embiggen.” Data available on request. Corrections welcomed. Strongly encouraged, even.

    Sources: 2016 population, https://www.census.gov/quickfacts/fact/table/US/

    Killed by Police, Washington Post, https://github.com/washingtonpost/data-police-shootings

    Update July 17: Thanks to I.L., corrected and updated.

    Update: 2020 caveat.

  • Milwaukee Police Chief Edward Flynn: “We’ve got to get beyond the finger pointing that does nothing except to depolice at risk communities”

    Milwaukee Police Chief Edward Flynn is smarter than your average flatfoot. Generally considered a progressive in the police world, he’s the type of chief who should at least be embraced by the political left. But Milwaukee is one of the latest police department to be sued by the ACLU for racially disparate policing. But Flynn refuses to de-police the city’s most violent streets. For this, Flynn gets heat from all sides: Republican senators, the anti-police crowd, and conservative Sheriff David Clarke (the Milwaukee County Sheriff better known for his Trump-loving cowboy-hat wearing general buffoonery).

    Most recently, Flynn didn’t take kindly to lawsuits from the ACLU making him and his police department out to be the bad guys. This is worth watching. “Disparity is not the same as bias,” Flynn says. That’s an important point that needs to be said loud and clear. If not, we abandon those most at risk. Here’s an edited six minutes of Flynn:

    [The full version is here.]

    Flynn understands the political equations. He frames the right questions. He give the right answers. And he can talk about “ellipses” of social problems, explicit and implicit biases, negative social indicators, evidence-based policing, and the history of racist policing in America. As my father always said, if you get criticized for all sides, you must be doing something right.

    [my next post on Flynn]

  • What a difference a year makes…

    What a difference a year makes…

    There’s an article in Criminology & Public Policy by Justin Nix, Bradley Campbell, Edward Byers, and Geoffrey Alpert that has gotten some press: “A Bird’s Eye View of Civilians Killed by Police in 2015: Further Evidence of Implicit Bias”

    Although we could not determine whether officers were quicker or more likely to fire their weapon at minority suspects, we argue that if minorities were more likely to have not been attacking the police/other civilians, or [emphasis added*] more likely to have been unarmed, this would indicate the police exhibit implicit bias by falsely perceiving minorities to be a greater threat to their safety.

    I replicated their data and got 93 “unarmed” suspects killed in 2015. (Replicating data should be a given, but often it is not. So kudos to the authors for this.) In 2015, 38 unarmed black men and 32 unarmed whites were shot and killed by police. If the distribution were proportional to all those shot and killed, one would expect 24 blacks and 46 whites killed. This is a statistically significant difference. From this, the authors conclude “Black civilians were more than twice as likely as White civilians to have been unarmed.” Twice sounds big. The absolute number? Not so big. Still, if you’re one of the 38 unarmed black men killed, it matters.

    Here’s armed versus “unarmed” by race (for whites and blacks), for 2015 [click both to “zoom” and “refine”]:

    I also looked at “threat level.” For 2015, I get what the authors get:

    You can see that for the threat = “other” (Ie: non-attack, in theory), one would “expect” to find 49.9 blacks in that square (if race wasn’t a factor). But in reality 63 blacks were killed. That’s a big and statistically significant difference.

    [I’m limiting the presentation of my analysis (as is my wont) to percentages, crosstabs, and univariate correlations. If one can’t describe statistics to a lay-person, it all becomes too abstract. And a problem with doing advanced statistics is then most people don’t understand what they mean (and that includes most academics). And so then the reader has to take the scribe at their word.]

    [Also, I have serious non-trivial issues with categorizing “other” as “non-attack,” but I’ll leave that aside, until my next post. Also, for replication purposes, I too exclude “undetermined” threat level (n = 42), but I don’t think one should. More on that in the next post.]

    Here’s where things get interesting! Unlike the authors, I can publish this in seconds and, for better and for worse, not wait for peer review (though corrections and comments are always welcome).

    So with the click of a button on SPSS (a statistics program), I can include 2016 data and even 2017 data right up to February 8 (when I downloaded the data).

    Here’s what I get when I do their analysis on threat, but for 2016:

    Compared to 2015, in 2016 the results are reversed. This is a big deal. There are fewer blacks in the “other” threat level than one would expect. And the results are equally statistically significant.

    A similar things happens when one looks at armed and unarmed (again, I think this is too simplistic of a division, but that’s what they use).

    Here’s armed versus unarmed by race, for 2016:

    While the data isn’t completely reversed, the differences in 2016 are minor enough (and the “n,” the number of cases, small enough) that the racial disparity is no longer statistically significant.

    What gives? Did the problem of racial disparity in police-involved killings disappear last year? Did it even reverse? I don’t know. But replicating the 2015 study with 2016 data would lead to a very different conclusion.

    Here are some other interesting tidbits.

    • From 2015 to 2016, total shootings deaths by police went down from 990 to 963. Given the increase in homicide, I would have expected the number of police-involves shootings to go up (they are usually correlated). I suspect that the number went down because A) given the focus on the issue of police-involved shootings, cops are less likely to pull the trigger and B) the number of discretionary interactions between cops and criminals has decreased.

    • From 2015 to 2016, killings of unarmed people dropped from 88 to 49. The drop was most pronounced among blacks (35 to 17).

    • Twenty-five percent of those killed by police are known to have pretty major mental health issues. This is a Big Red Flag. No doubt the real number is even higher (undiagnosed mental health issues among the poor, or simply a family that doesn’t want to tell a reporter about it). Implicit racial bias might (or might not) contribute to a dozen or so deaths. Mental health issues contribute to 250 a year! You want to reduce shootings? Provide mental care for people who need it.

    • Seventy-eight percent of 2015 killings (This if from Nix et al.I haven’t recoded the 2016 data) happened in the South and West (with 60 percent of the population). Again, if one wishes fewer people to be killed by police, best to focus where police kill a lot of people.

    • We really need more data, not just on police involved killings, but on all police-involved shootings. A lot of people are shot and not killed. We know next to nothing about this. And we need to know the context of these shootings. How did they start? How many are initiated by a call for service rather than a police officer’s discretion?

    • We really need to be concerned about unintended consequences of policy decision. Perhaps a laser-like focus on police shootings and police misconduct combined with lawsuits against proactive policing really have ended the racial disparity in police-involved shootings. If so, that would be great. It’s just as likely that a laser-like focus on police shootings and police misconduct combined with lawsuits against proactive policing have contributed to less proactive policing and an increase in homicide. (It’s hard to argue one without the other, though people will try. Oh, they will try.) Eighteen fewer unarmed blacks were shot and killed by police in 2016 compared to 2015. Meanwhile, 2,000 more were murdered, most of them black (using the Brennan Center’s estimate of a 13 percent increase in homicide).

    It’s not crazy to see some connection between these two variables: less proactive policing could [ie: does] mean fewer police-involved shootings and also more criminal shootings. Is this the best we can do? Is this the trade-off we want? Can one or should one talk about the value the lives in this way? I don’t know. But since more people are dying (though fewer at the hands of police) these are things we need to be talking about.

    • Also, the number of unarmed Asians killed by police since 2015: Zero (of 30 killed, total).

    [* The use of “or” is interesting. The numbers are really low. Cops just don’t shoot many unarmed unarmed attackers. You can’t really do multivariate analysis on a few dozen cases. Given the number of people killed by police, you can’t look at racial discrepancies (statistically) when the person killed is not-attacking cops and unarmed.]

    [comments are (only) available on the next, related, post.]

  • “How much do they care?”

    My previous post was supposed to be about this article by Frank Zimring from 42 years ago. But then I got caught up in the false data put out by the Brennan Center.

    A friend sent me this fascinating article (“A Tale of Two Cities,” Franklin Zimring, December 20, 1974, Wall Street Journal, p.14) because some of it regarding “the troubles” in Northern Ireland is blessedly dated. But much of what he wrote could be published tomorrow and considered current. (Also, I was a little shocked to learn Zimring was a professor and writing in 1974. I was three. And he’s still doing well.) His point was that more people, by far, are killed in Detroit. But everybody is much concerned about violence in Northern Ireland. (By American standards, Northern Ireland was never that lethal with (3,600 killed over 32 years.) Why?:

    When do people perceive violence as a major social problem, and why? What kinds of antiviolence programs will they tolerate? How much do they care?

    Detroit is used to high homicide rates; most of those killed in Detroit are ghetto dwellers; and killings in Detroit are not a direct threat to public political order as it is in Ulster,

    The first reason why Detroit (and her sister cities) can absorb so much violence without alarm is that Americans have had ample time to get used to high homicide.

    But how is it possible to adjust to such rates of violence? In an important sense, it’s easy.

    Because most of the urban body count in the United States involves the faceless young black male “non-citizens” who live and die without conspicuous outpourings of social concern. It is, in fact, misleading to talk of a single homicide rate in American cities, because ghetto-dwelling blacks kill and are killed at rates 10 times as high as big-city whites. Urban violence does, of course, affect a broader spectrum of society–small shopkeepers, street robbery victims, and men, women and children who just happen to be at the wrong place at the wrong time. But the great majority of victims are the black poor.

    And most of us are pretty safe, after all….Perhaps we can protect ourselves and accept violence as an occupational hazard of urban life for the poor?

    Yet there are moral and practical problems with learning to live with violence… The moral problems lie at the heart of the American dream our national greatness is defined in large measure by what we can provide for the least-advantaged among us

    Yet the prospects for constructive action are dim…. The political cant that passes for dialog on violence in this country is simply another symptom of failure to face up to our profoundly serious problems.

    Even with the best of intentions, our urban body count will be hard to diminish. If we continue to adjust to bloodletting, and to view violence as a nonproblem, there is every chilling prospect we will get what we deserve.

    In another 42 years, in 2058, I’d like to think this piece will no longer be timely. But I doubt it. What’s happened in the past 42 years? Half of Detroit left, literally. The population of Motor City dropped from 1,513,000 to 689,000. And the homicide rate? It’s right where it was, 42 year ago, just under 50 per 100,000.

  • “Number Two” at the range

    “Number Two” at the range

    Two days ago in the Bronx, an NYPD sergeant shot and killed Deborah Danner, a 66-year-old with schizophrenia armed with a baseball bat. Deborah Danner’s death is a tragedy. It is a failure of the system. But almost immediately, the officer who shot was stripped of his badge and gun and denounced by the mayor and police commissioner. DeBlasio — who according to the Times, “struggled to answer basic questions about the shooting” — felt he knew enough to throw the cop under the bus:

    The shooting of Deborah Danner was tragic, and it is unacceptable. It should never have happened. It is quite clear our officers are supposed to use deadly force only when faced with a dire situation. And it’s very hard for any of us to see that that standard was met here.

    Really? At NYPD target practice, there’s a simple shoot/don’t-shoot scenario. (This is something we did not have in Baltimore, which might help explain the NYPD’s overall extremely low rate of using lethal force.)

    The guy with a bat is known as “Number Two.” When you hear, “Number Two,” you’re supposed to see the guy with a bat and shoot Mr. Number Two. (Also Three and Four, but not Numbers One or Five.)

    I am not saying this was a good shooting. I am saying that if we don’t want cops to shoot people with baseball bats, why do we train cops to do just that?

    The mayor continued:

    There was certainly a protocol that called for deferring to the Emergency Service Unit (ESU). That was not followed. There was obviously the option of using a taser. That was not employed. We will fully investigate this situation and we will cooperate fully with any prosecutorial agencies. We need to know why this officer did follow his training and did not follow those protocols.

    [The New York State attorney general said he would not investigatethe shooting.]

    Protocol, so I hear, does say that officers confronted with an emotionally disturbed armed person (apparently initially naked and armed with scissors) should back off, close the door, and call for ESU and wait.

    I’m not convinced the department really wants this to happen all the time. This protocol, let’s call it Plan B, would tie up a few officers for a few hours in what would then be a barricade situation. It would also draw on the military-like resources of ESU.

    Plan A is for two cops to simply handle the inncident quickly and professionally, and get back in service to handle the next call. When violating “protocol” is routine, even encouraged, it’s not fair to only crack the whip when things go bad.

    But one thing about these events is they can change police culture quite quickly. ESU is now going to have a lot more work, for better or for worse. But wouldn’t be ironic if ESU responded to every call, especially in light of demands to de-militarize the police? And then what happens when ESU kills somebody? Then we blame ESU?

    Then who do we call? The really issue is that police shouldn’t be responding to this type of call at all.

    Here’s Alex Vitale (whom I’m actually agreeing with!) in the Gotham Gazette:

    The fact that police had to even be dispatched in the first place is a sign that something went wrong.

    Health officials knew about this woman’s condition…. Why was she returned to her apartment without adequate ongoing supervision or care?

    Yet thousands of profoundly disabled people continue to roam the streets and subways or idle away at home with little or no support, leaving police to deal with the crises that inevitably result.

    The mayor was wrong when he said that current training is adequate and this was just the mistake of a single officer. Ultimately, police are the wrong people to be responding to a person experiencing a mental health crisis.

  • Dejuan Yourse Arrest

    For the life of me, I can’t figure what Yourse is going to be charged with. Even with the game rigged in cops’ favor, I don’t see a crime. Yourse is under arrest after 9:10 when the officer doesn’t take kindly to Yourse invited his friends over. I can understand why the officer doesn’t want a posse of friends showing up at the scene, but what’s the crime? This was in Greensboro, NC.

    I’d be curious to see how he’d be able to articulate reasonable suspicion at 8:13. I’m not saying he couldn’t; it’s a low standard. But I’d like to see how. That’s when things go South. Before that moment, everybody is playing along and sticking to the script. Poking a guy rarely serves any tactical benefit. Alternative if you don’t want him to leave? Hold your palm out. If you’re going to make physical contact, let the suspect initiate it. Also then you’re in a better position to push back or grab.

    After that, it becomes your standard shit show of trying to get a guy’s hands behind his back. First he is resisting arrest. But then even when he isn’t, it would seem like that because he’s so built that his arms don’t physically move in a way that can be cuffed (without double cuffs). Anyway, resisting arrest is a charge, but first you actually to be arrested for a crime before you can be charged with resisting. The standard catch-alls — loitering, failure to obey, disorderly — none of those even seem to apply here.

    Anyway, word on the street (ie: a journalist told me) is that the officers resigned. I’m not going to defend how the male officer handled this. He sure could have benefited from de-escalation or common sense. I mean, as long as he doesn’t come back wanted, I’m pretty convinced he’s not breaking into the house. Too bad she wasn’t handling this with him running the warrant check. But why in the world would she resign? Unless the lied on her report or something.

    Also, once again, you have cops serving as force multipliers, forced into a situation by a call from an ignorant and/or racist citizen. That happens a lot. But it may not be the case here.

    My wife just told me that Yourse actually was wanted on some warrant, but the cops didn’t know that yet when the arrested Yourse. According an attorney for the Greensboro Police Association:

    Once Mr. Yourse was taken into custody, the officers were able to continue attempting to verify his identity. Upon doing so, it was learned that Mr. Yourse had two active warrants for his arrest, along with two additional orders for his arrest [?]. Additionally, they discovered that Mr. Yourse had been charged twice in the past for breaking into his mother’s house, 2 Mistywood Ct.