Building on my previous post on data presentation, I did some grunt work to get a count of murders and shootings for each and every day since January 1, 2012. (If you think that’s easy or [that] can be readily downloaded, you’re wrong. Update: I could have saved a few hours of grunt work had I thought of using the =VLOOKUP function in excel to fill in missing dates that had no major crimes.)
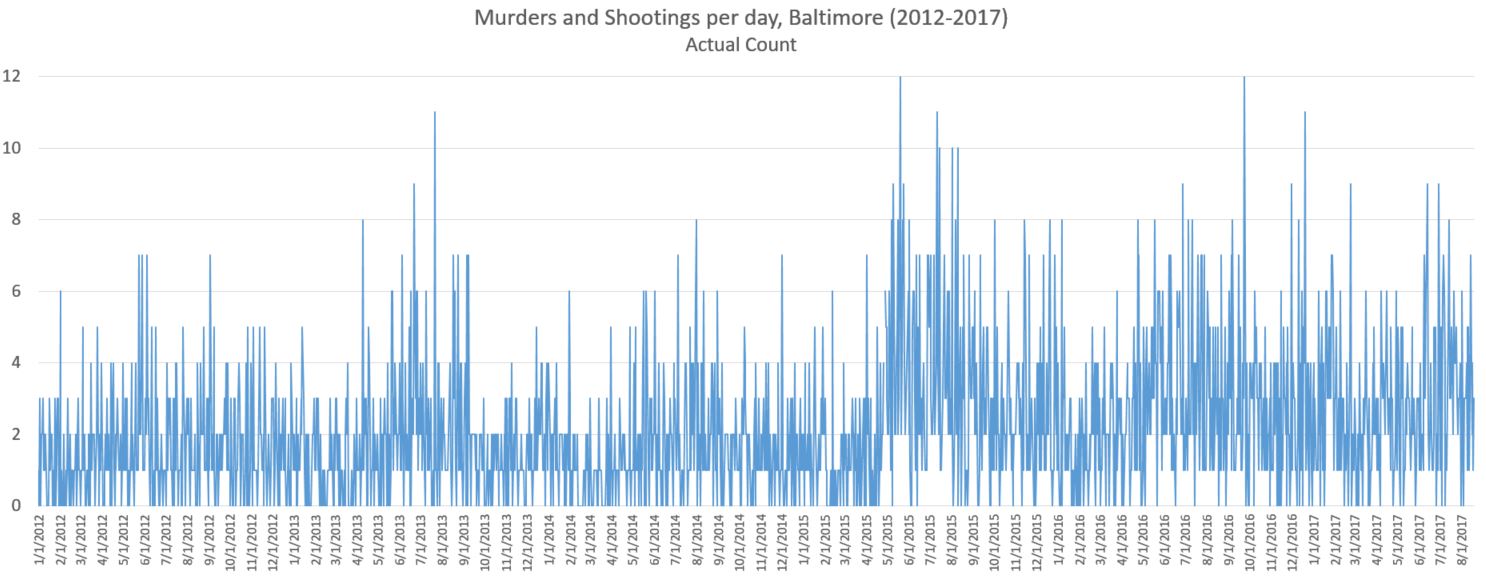
If you simply chart the data, you get this kind of chart, which might be cool in an abstract expressionist blurry kind of way, but it’s next to worthless as a form of data presentation.

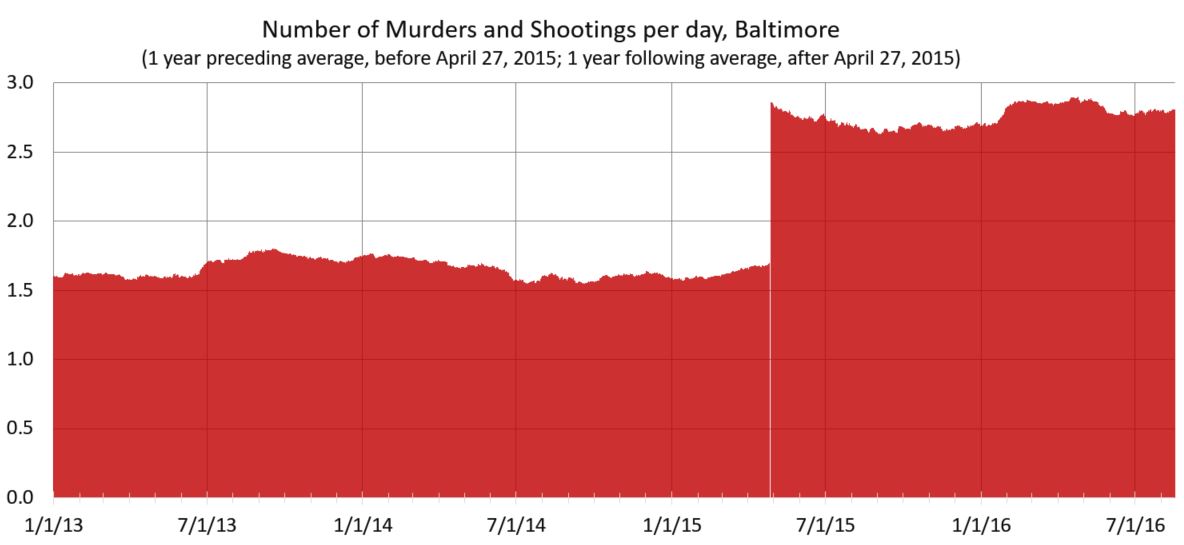
Here’s the same data, given a bit of love and handling. For all the reasons mentioned in my previous post. I went back to a one-year moving average, split on April 27, 2015, the day of the Baltimore riots. (Pre-riot takes the average from preceding year; post-riot from the year following.) What I’m trying to highlight, in an honest way, is the large spike in murders and shooting immediately after the riots and Mosby’s decision to bring flimsy criminal charges against six Baltimore City police officers.

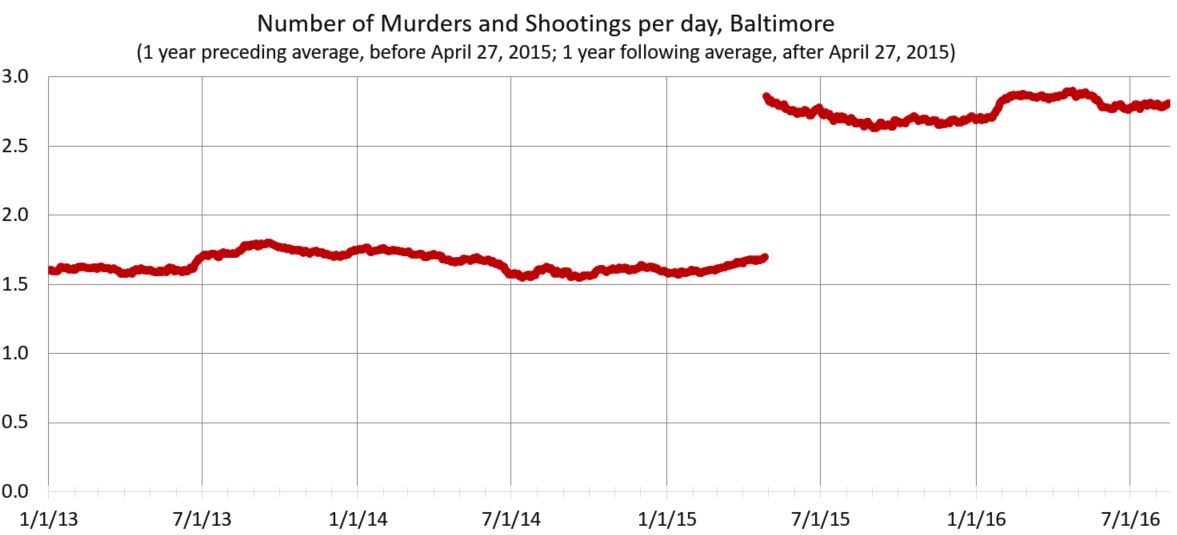
Unlike other crimes, shootings and homicides are reported quite accurately. Other crimes will rise and fall in sync. (And if the data doesn’t show that, consider those data flawed, particularly in terms of less accurate reporting.) And if you’re more partial to a line graph:

The riots were a big deal, but nobody died. More important to policing and public safety was what happened after the riots. Nobody was holding the tiller. The department was basically leaderless. The mayor had been almost in hiding. Then Mosby made the biggest mistake of all. She criminal charged six officers for doing their job — legally chasing and arresting a man running from an active drug corner (this man, Freddie Gray, then died in the police van and that led to riots). Mosby got no convictions because she had no case. She couldn’t prove a crime, much less culpability. She would later say, “I think the message has been sent.” Police got the message: if you do your job and somebody dies, you might face murder charges. Activists and Baltimore’s leaders pushed a police-are-the-problem narrative.
Police were instructed — both by city leaders and then in the odd DOJ report city leaders asked for — to be less proactive since such policing will disproportionately affect minorities. Few seem to care that minorities are disproportionately affected by the rise in murder. Regardless, police were told to back off and end quality-of-life policing. So police did. But, unlike the arrest-’em-all strategy formulated by former Mayor O’Malley (which worked at reducing crime a little) discretionary enforcement of low-level offenses targeting high-risk offenders reduced violence a lot. It also sent a proper message to non-criminals that your block and your stoop were not going to be surrendered to the bad boys of the hood.
Of course these efforts will disproportionately affected blacks. In a city where more than 90 percent of the murderers and murder victims are black, effective anti-violence policing will disproportionately affected blacks (Of course, bad policing will, too). The rough edges of the square can be sanded down, but this is a square that cannot be circled. Reformers wanted an end to loitering and trespass arrests. Corner clearing basically came to a stop. Add to this other factors — fewer police officers, the suspension of one-person patrol units, poor leadership — and voilà: more violent criminals committing more violent crime.
Murders and shooting increased literally overnight, and dramatically so. Of course this took the police-are-the-problem crowd by surprise. By their calculations, police doing less, particularly in black neighborhoods, would result in less harm to blacks. And indeed, arrests went way down. So did stops. So did complaints against policing. Even police-involved shootings are down. Everything is down! Shame about the murders and robberies, though.
Initially this crime jump was denied. Now we’re supposed to think it’s just the new normal for a city in “transition.” How about this narrative: police and policing matter; and despite all the flaws in policing at a systemic and individual level, police and policing are still more good than bad, especially for society’s most at risk. There is no reason to believe that the path to better policing much pass through a Marxist-like stage of “progressive reform” before improving. We pay police, in part, to confront violent criminals in neighborhoods where more than 20 percent of all men are murdered. We own this to those, all of those, who live there. To abdicate police protection in the name of social justice in morally wrong.
And lest you think this rise in crime is only a problem in Baltimore, be aware that over the past three years, homicide is up dramatically in America, almost everywhere. Not just Baltimore and Chicago. Unprecedentedly so, in fact.
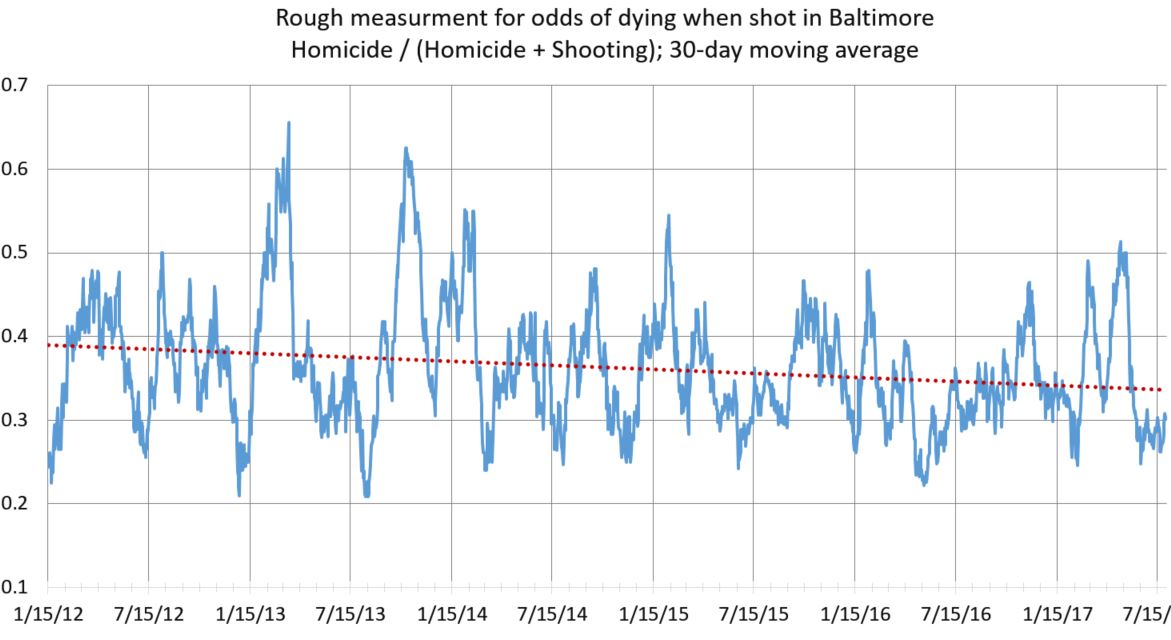
In related news, the odds of dying if shot in Baltimore have gone down slightly since 2012, presumably because of better medical care. It’s a crude measure, but notice the downward slope of the trend line. The chance of dying has gone down from 39 percent to 34 percent. Also note the seasonal changes in mortality. I don’t know why that is.


[Had to repost comments. Sorry:]
Mosby said…
Ref your last graph: could the seasonal differences in mortality have to do with weather? Simple matter of ambulances driving faster/slower in rain/snow/dark?
And/or is there seasonal change in the availability of ER personnel due to graduations, med school rotations, etc?
September 4, 2017 at 9:49 AM
Madden said…
That seasonal variation is really interesting. The only thing I can think of is that there are fewer people outside when its cold. Everyone has their windows closed so the sound of gunshots is muffled. Maybe the mortality rate goes up just because it takes longer for someone to notice a victim and call for help.
September 4, 2017 at 3:20 PM
Moskos said…
I think it's fewer street shootings. More close range better shots. Perhaps street gun homicides go down in winter (they do) while domestic homicides stay constant? To look more into this, one would really need to get hospital and EMS data. This measurement is crude, since it includes all homicides and compares that to shooting victims. Though in in Baltimore this isn't a huge issue since most 85-90 percent of homicides are shooting (but that may change in the winter). And this doesn't take into account those who are killed before any medical help could arrive. On the flipside, though, with fewer shooting victims, one might expect police response and medical care to be better.
September 4, 2017 at 4:01 PM
Wallace said…
There is obviously seasonality in violent crime and homicides.
I think your data presentation is technically ok. I think if you displayed the data as a histogram using annual increments split on the date of the riot, you would have roughly what you are showing. This is about as vanilla as you can get. Annual increments eliminates seasonality. Or a bar graph.
The decision to use the date of the riot to split the data is perfectly reasonable. Either something changed or it didn't. In other cities there was a sharp change, but it generally happened over a period of days or weeks or maybe two or three distinct days.
September 5, 2017 at 2:57 AM
Blue said…
It looks like mortality is worse both in summer and the end of year. Is this just a staffing issue? Staffing always sucks during summer vacation months as well as during the holiday season. More cops to clear the scene quicker, more EMTs to get them to the hospital quicker, and more hospital staff to prep and care for them until they get into surgery.
September 5, 2017 at 1:55 PM
Liberaltarian said…
That seasonal variation is incredible. It looks pretty strongly correlated year to year and the difference between 20-30% in the lows and 60-70% in the highs is a HUGE difference. They cannot be just randomness.
September 5, 2017 at 3:03 PM
Wallace said…
Why would anyone assume homicides are any less seasonal than retail sales?
Is anyone surprised sales are high in December?
Any cop or ER can tell you the days of the week, holidays, and months that are busy.
4th of July? New Years? Saturday night? The easiest approach is to annualize the data or compare year to date figures. From there — the only reason to put a finer point on it would be to try to identify a change in trend earlier.
September 5, 2017 at 5:05 PM
Blue said…
@ Wallace,
The surprise is not in violence varying by season. The surprise is in a higher mortality rate given those who have been shot varying by season. In other words a guy shot in January has a better chance of living than a guy shot in August.
It should be possible to plot mortality rate as a function of total shot per day to determine if/how much taxing healthcare services (by total numbers of patients or by limited staff) has an effect.
September 6, 2017 at 12:58 AM
Thos Wallace said…
Sorry … I missed your point. The elephant in the room is the number of homicides.
Maybe they are wearing more clothing in the winter which reduces the effectiveness of the ammo. Not that it isn't an interesting question. But it is a lot more complicated.
September 6, 2017 at 2:47 AM